
In our last report on AI Winners and Losers, we revealed how free cash flows for many of the top AI companies are in free fall. That’s not the end of the story. Declining free cash flows are the canary in the coal mine. It’s time to sell most of big tech.
For years, these big tech companies operated in a class all their own: generating billions in Core Earnings, high free cash flow (FCF), strong profit margins, and best-in-class returns on invested capital (ROIC).
Massive AI spend is upending this long-held notion. It’s turning the asset-light tech companies into capital intensive businesses, just like the Materials, Industrials and other traditionally capital-intensive sectors.
As Aswath Damodaran puts it:
“…AI, even if it delivers much-touted gains in productivity, is likely to lower profitability in the aggregate and make the business end game even more difficult to win.”
The market is staring at an AI future where big tech companies have Industrials-like levels of capex and generate Industrials-like levels of return. In such a scenario, there’s no straight-faced argument for the AI tech giants to retain their current sky-high valuations, even after the pullback already seen this year.
Everything Looks Fine at the Surface
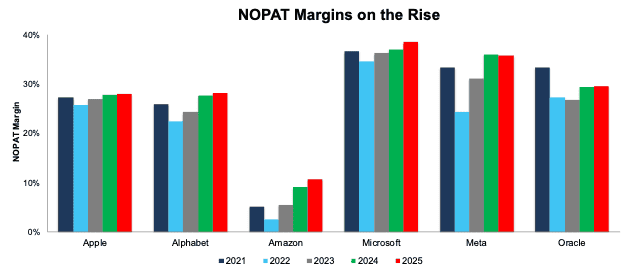
Because most financial analysis focuses so much on the Income Statement, investors are likely unaware of the deteriorating conditions below the surface. For instance, net operating profit after-tax (NOPAT) margins for Apple (AAPL), Alphabet (GOOGL), Amazon (AMZN), Microsoft (MSFT), and Meta (META) increased from 2021-2025.
Oracle (ORCL) is the only company in Figure 1 with a lower NOPAT margin in 2025 than in 2021, but even so, its NOPAT margin has improved in more recent years.
Figure 1: AI Spenders’ NOPAT Margin: 2021-2025
Sources: New Constructs, LLC and company filings
Due to Oracle’s fiscal year, data is from November 2021 through November 2025. All other data is from December 2021 through December 2025
But Big Tech’s FCF Efficiency is Falling
As we noted in “The Hidden $500+ Billion Accounting Trick That Will Sink These AI Stocks,” off-balance sheet debt that is draining these tech giants’ free cash flow (FCF).
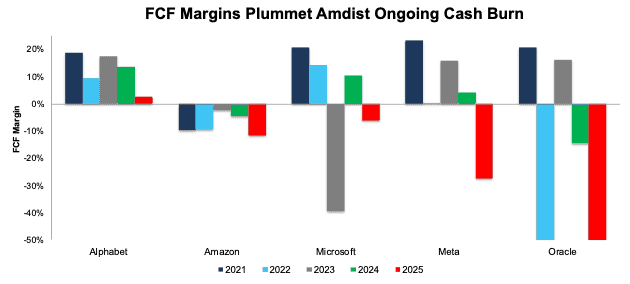
FCF margins, which measure how much FCF a company generates per dollar of revenue, are also deteriorating.
Historically, big tech companies generated strong FCF margins. Not so much in 2025.
Alphabet, Amazon, Microsoft, Meta, and Oracle’s FCF margin fell substantially between 2021 and 2025.
Oracle stands out, and not for good reasons. The company’s FCF margin fell from -15% in 2024 to -317% in 2025, which is, quite literally, off the chart in Figure 2.
Apple’s FCF margin fell too, but at 76% in 2025, remains well above the companies shown in Figure 2.
As in our FCF analysis in our prior report, Alphabet stands apart from the rest of the group (Apple too) and generates the second highest FCF margin in 2025, behind Apple.
All the spending begs the question though; will these companies ever recoup their cash losses?
Figure 2: AI Spenders’ FCF Margin: 2021-2025
Sources: New Constructs, LLC and company filings
Due to Oracle’s fiscal year, data is from November 2021 through November 2025. All other data is from December 2021 through December 2025
Balance Sheet Efficiency Deteriorates
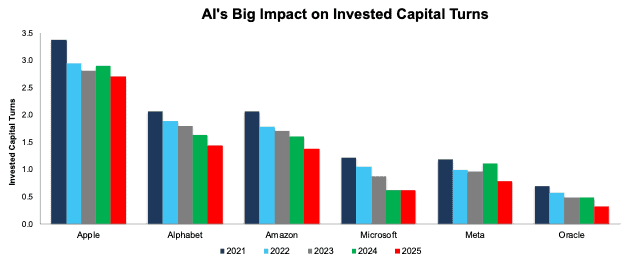
The big tech giants are not only generating less FCF per dollar of revenue, but they’re generating less revenue per dollar of invested capital. In other words, balance sheet efficiency is collapsing.
Apple, Alphabet, Amazon, Microsoft, Meta, and Oracle’s invested capital turns, a measure of balance sheet efficiency, steadily declined from 2021-2025. See Figure 3.
Figure 3: AI Spenders’ Invested Capital Turns: 2021-2025
Sources: New Constructs, LLC and company filings
Due to Oracle’s fiscal year, data is from November 2021 through November 2025. All other data is from December 2021 through December 2025
The Ultimate Impact – Lower Returns on Invested Capital
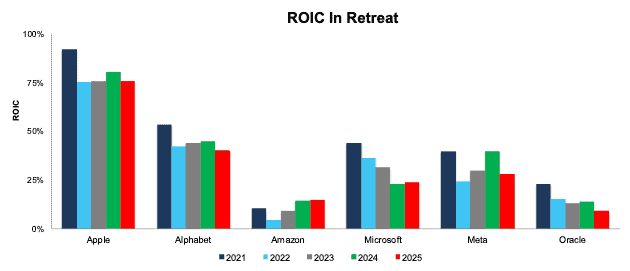
Big tech’s steady operational efficiency (NOPAT margin) is not enough to offset the material decline in balance sheet efficiency (invested capital turns), and as a result, ROICs are falling too.
The ROIC for each of the companies in Figure 4, with the exception of Amazon, have fallen since 2021:
- Apple: 76% in 2025, down from 92% in 2021.
- Alphabet: 40% in 2025, down from 53% in 2021.
- Microsoft: 28% in 2025, down from 44% in 2021.
- Meta: 28% in 2025, down from 40% in 2021.
- Oracle: 10% in 2025, down from 23% in 2021.
Figure 4: AI Spenders’ Return on Invested Capital: 2021-2025
Sources: New Constructs, LLC and company filings
Due to Oracle’s fiscal year, data is from November 2021 through November 2025. All other data is from December 2021 through December 2025
While Apple, Alphabet, Microsoft, Meta, and even Amazon’s ROICs still rank in the top-quintile of companies under coverage, the downward trend is underway and likely to persist as long as AI spending persists.
We think AI spending is in the early innings because it has only focused on hardware and infrastructure and not the data fed to the AI. We expect an entirely new AI spending spree to acquire high-quality datasets that can endow machines with deep subject matter expertise. When AI can deliver correct, truthful answers to questions that experts would ask or that require deep subject matter expertise, then we can expect an explosion in AI-driven revenue and profits. Until then, we see AI’s utility as far below what’s needed to generate an adequate return on the gigantic AI spend. More details in our last report on AI Winners and Losers.
There’s No Value Left in the Big Tech AI Trade
Still looking for value in the AI trade? Look elsewhere. With falling cash flows and deteriorating ROICs, all the stocks in this report look very expensive.
Each stock in this report trades well above its economic book value, or no-growth values, which means market expectations imply profits will grow quite substantially from current levels.
At some point, the cash burn and ROIC contraction has to sharply reverse into cash flow generation and greater ROICs for these stocks to maintain current valuations and avoid major declines.
Amazon and Oracle stocks look the riskiest. They sport the largest cash burn and have the worst price-to-economic book value (PEBV) ratios. On the other end, Microsoft stands out as having the “cheapest” valuation, though that is largely relative to the other tech giants in Figure 5. Its PEBV ratio of 2.3 means the market expects its profits to grow 2.3x from TTM levels, which is no small expectation.
Investors buying at today’s prices should know that the expectations for future cash flow growth already baked into the stock prices are very high, especially considering the declines we are seeing in FCF margins, invested capital turns, and ROIC.
Figure 5: AI Spenders’ PEBV Comparison: Trailing Twelve Months (TTM)

Sources: New Constructs, LLC and company filings
This article was originally published on February 23, 2026.
Disclosure: David Trainer and Kyle Guske II receive no compensation to write about any specific stock, style, or theme.
Questions on this report or others? Join our online community and connect with us directly.