
Wall Street analysts are too bullish on third quarter earnings expectations for 75% of S&P 500 companies.
In theory, Wall Street analysts adjust EPS for unusual gains and losses that distort reported EPS. In reality, they do not. Street EPS estimates are materially misleading more often than investors realize[1].
This report shows:
- five S&P 500 companies with overstated Street estimates likely to miss 3Q21 earnings
- why Street Earnings, GAAP Earnings, and consensus estimates are flawed
- how our Core Earnings[2] and Earnings Distortion factor generate novel alpha
Get our report on the S&P 500 companies more likely to beat 3Q21 Street EPS estimates here.
Street Overstates EPS for 375 S&P 500 Companies
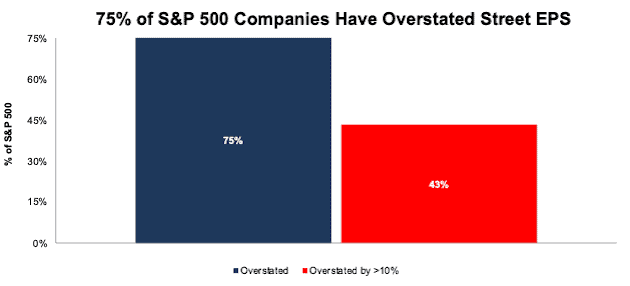
Per Figure 1, Street EPS overstate Core EPS for 75% of S&P 500 companies for the trailing-twelve-months (TTM) ended calendar 2Q21[3]. For 43% of S&P 500 companies, Street EPS are overstated by more than 10% (examples are below).
Figure 1: Street Earnings Are Overstated for a Large Amount of S&P 500 Companies
Sources: New Constructs, LLC and company filings.
When the Street EPS overstates Core EPS, it does so by an average of 24% per company, see Figure 2.
Figure 2: Street Earnings Overstate by 24% on Average

Sources: New Constructs, LLC and company filings.
Five S&P 500 Companies Likely to Miss Calendar 3Q21 Earnings
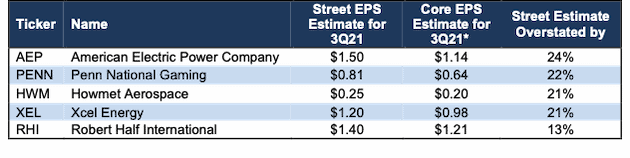
Figure 3 shows five S&P 500 companies likely to miss calendar 3Q21 earnings based on overstated Street EPS estimates. Below we detail the hidden and reported unusual items that have created Street Distortion, and overstated Street Earnings, over the TTM for Penn National Gaming (PENN). Contact us for the same details on the other companies.
Figure 3: Five S&P 500 Companies Likely to Miss 3Q21 EPS Estimates
Sources: New Constructs, LLC and company filings and Zacks.
*Assumes Street Distortion as a percent of Core EPS is same for 3Q21 EPS as for TTM ended 2Q21.
Penn National Gaming: The Street Overstates Earnings for 3Q21 by $0.17/share
The Street’s 3Q21 EPS estimate of $0.81 for Penn National Gaming is overstated by $0.17/share due, at least in part, to large gains on equity securities (not its core business) in third-party, sports-betting operators included in historical EPS. Our Core EPS estimate is $0.64, which makes Penn National Gaming one of the companies most likely to miss Wall Street analysts’ expectations in its calendar 3Q21 earnings report.
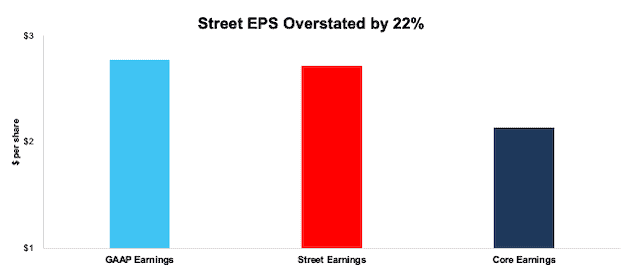
Unusual gains, which we detail below, materially increased Penn National Gaming’s 2Q21 TTM Street and GAAP earnings and makes profits look better than Core EPS. When we adjust for all unusual items, we find that Penn National’s 2Q21 TTM Core EPS are $2.13, which are below 2Q21 TTM Street EPS of $2.72 and 2Q21 TTM GAAP EPS of $2.77.
Figure 4: Comparing Penn National’s Core, Street, and GAAP Earnings: TTM as of 2Q21
Sources: New Constructs, LLC and company filings.
Below, we reconcile the differences between Penn National’s 2Q21 TTM Core EPS and GAAP EPS so readers can audit our research. Usually, we cannot reconcile Core EPS to Street EPS because we do not have the details as to exactly what makes them differ from GAAP EPS. However, given that Street and GAAP EPS are nearly the same, it follows the reconciliation of Core to GAAP EPS is the same for Street EPS.
Figure 5: Penn National’s GAAP Earnings to Core Earnings Reconciliation: TTM

Sources: New Constructs, LLC and company filings.
More details[4]:
Reported Unusual Gains, Net = $0.72/per share, which equals $115 million and is comprised of:
- $123 million in “Other Income” related to holding gains on equity securities in the TTM period, based on
- $68 million in 3Q20
- $31 million in 4Q20
- $21 million in 1Q21
- $3 million in 2Q21
- -$7 million impairment loss in the TTM based on -$623 million in impairment losses in 2020
- -$1.2 million loss on extinguishment of debt in the TTM, based on -$1.2 million loss in 2020
Hidden Unusual Expenses, Net = -$0.02/per share, which equals -$4 million and is comprised of:
- -$3 million in non-operating expenses hidden in operating earnings in the TTM period, based on
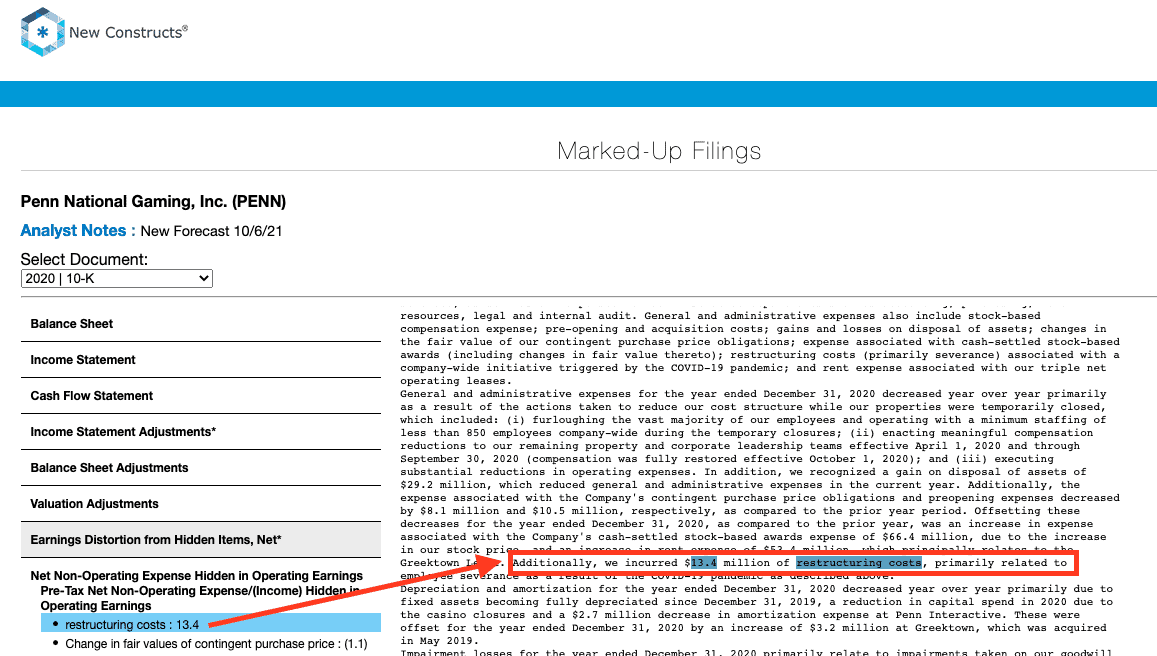
- -$7 million restructuring costs in the TTM based on -$13 million restructuring costs in 2020
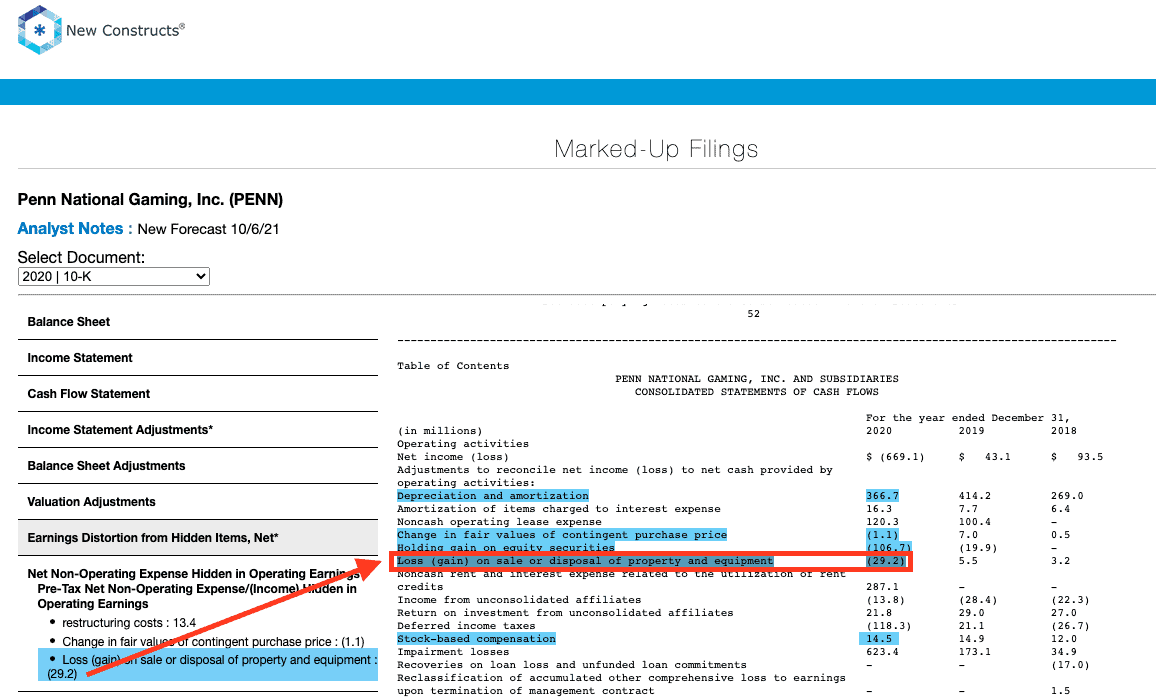
- $4 million gain on sale in the TTM based on $29 million gain on sale or disposal of property and equipment in 2020
- -$1 million in hidden other non-recurring expenses in the TTM period, based on
- $0.6 million in changes in fair value of contingent purchase price in the TTM, based on $1.1 million in 2020
- $0.1 million in changes in fair value of contingent purchase price in 1Q21
- -$1.4 million in changes in fair value of contingent purchase price in 2Q21
- $0.2 million gain on sale or disposal of property and equipment in 2Q21
Tax Distortion = -$0.06/per share, which equals -$9 million
- We remove the tax impact of unusual items on reported taxes when we calculate Core Earnings. It is important that taxes get adjusted so they are appropriate for adjusted pre-tax earnings.
With overstated earnings, Penn National Gaming earns a Miss Earnings Distortion Score, which is our short-term predictor of the likelihood a company misses expectations in the next quarter. Its low return on invested capital (ROIC) and slightly elevated expectations for future profit growth baked into its stock price earn it a Neutral Overall Stock Rating.
Conclusion: Generate Novel Alpha with More Reliable Core Earnings
As demonstrated above, Core Earnings do a better job of excluding unusual gains and losses and provide a more reliable earnings measure. All Core Earnings adjustments to GAAP Earnings are 100% transparent; so users can audit and trust the research.
To enable you to easily monetize our novel factor, Earnings Distortion, we present multiple trading strategies that drive alpha. Learn more below.
- ExtractAlpha presents a long/short market-neutral strategy that generates 9.3% annualized return net of Fama-French 5 factors, momentum, short-term reversal, and 12 sectors. More details here.
- CloudQuant presents two strategies to monetize the alpha in Earnings Distortion:
- the long-only portfolio outperformed the S&P 500 by an average of 4% per annum over 10 years
- the dollar-neutral long-short portfolio returned 60% over 10 years with a Sharpe Ratio of ~1 over the last five years. More details here.
- AltHub presents three strategies to monetize the alpha in Earnings Distortion:
- Earnings Distortion S&P 500 Smart Beta Portfolio: 10-yr annualized return of 13.9% vs 12.1% for the S&P 500 with a Sharpe Ratio of 0.97.
- Earnings Distortion ML Model S&P 500 Smart Beta Portfolio: 3-yr annualized return of 18.2% vs 13.7% for the S&P 500 with a Sharpe Ratio of 0.82.
- Truth Stocks (Companies without Earnings Distortion) Portfolios:
- S&P 500 Universe: 10-yr annualized return of 16.8% vs 12.8% for the S&P 500 with a Sharpe Ratio of 0.7.
- Russell 3000 Universe: 9.5-yr annualized return of 28.4% vs 12.6% for the S&P 500 with a Sharpe Ratio of 1.
- More details here.
This article originally published on October 8, 2021.
Disclosure: David Trainer, Kyle Guske II, Alex Sword, and Matt Shuler receive no compensation to write about any specific stock, style, or theme.
Follow us on Twitter, Facebook, LinkedIn, and StockTwits for real-time alerts on all our research.
[1] The same is true for other well-known “adjusted” measures of earnings: S&P’s “Operating Earnings” Remain Overstated in 2Q21.
[2]The Journal of Financial Economics proves that only Core Earnings enable investors to overcome the flaws in legacy fundamental data.
[3] The most recent Core Earnings and Street Earnings values are based on the latest audited financial data from calendar 2Q21 10-Qs.
[4] For unusual items found only in the latest 10-K, we show the amount applied to TTM calculation and link to the disclosure in the 10-K.