

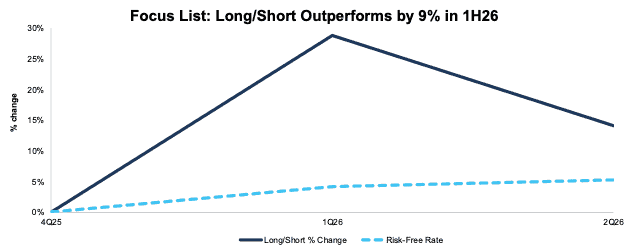
Our Focus List Stocks: Long Model Portfolio, the best of our Long Ideas, and our Focus List Stocks: Short Model Portfolio, the best of our Danger Zone picks, beat the Risk-Free Rate (RFR) [1] as a long/short portfolio by 9% in the first half of 2026 (1H26). See Figure 1.
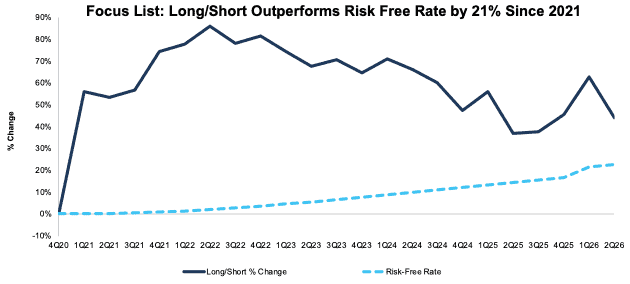
Longer term the Model Portfolio has outperformed the Risk-Free Rate as a long/short portfolio by 21% since the start of 2021 through 1H26. See Figure 2. This outperformance underscores how important reliable fundamental research is.
Figure 1: Focus List Stocks: Long/Short Performance vs. Risk-Free Rate: 1H26
Sources: New Constructs, LLC
Note: Gain/Decline performance analysis excludes transaction costs, dividends and rebates. The Risk-Free Rate is based on the 3-month T-bill.
The long portfolio was up ~12% and the short portfolio added ~2% for a net return of +14.1% compared to the Risk-Free Rate at +5.3% in 1H26. Note that short portfolios outperform when they fall more than the benchmark.
Figure 2: Focus List Stocks: Long/Short Performance vs. RFR: 2021 Through 1H26
Sources: New Constructs, LLC
Note: Gain/Decline performance analysis excludes transaction costs, dividends and rebates. The Risk-Free Rate is based on the 3-month T-bill.
Figure 3 details the Model Portfolios’ performance, which includes all stocks present in the Model Portfolios at any point in 1H26.
Figure 3: 1H26 Long/Short Performance of Stocks in the Focus List Model Portfolios

Sources: New Constructs, LLC
Performance includes stocks in the Model Portfolio in 1H26 as well as those removed during the same time (6 stocks).
The Focus List Stocks: Long Model Portfolio leverages superior fundamental data, which provides novel alpha. Professional and Institutional members get real-time updates and can track all Model Portfolios on our site.
We’re here to help you navigate any market cycle. Our uniquely rigorous fundamental research consistently earns #1 rankings in several categories on SumZero over the last 61 months.
Check Out the Indices Based on New Constructs Research
While we’re writing about how our Focus List Stocks: Long Model Portfolio finds winning stocks, we should highlight the indices we’ve developed with Bloomberg’s Index Licensing Group. All three have outperformed the S&P 500 over the past five years. See Figures 4-6.
- Bloomberg New Constructs Core Earnings Leaders Index (ticker: BCORET:IND)
- Bloomberg New Constructs Ratings VA-1 Index (ticker: BNCVA1T:IND)
- Bloomberg New Constructs 500 Index (ticker: B500NCT:IND)
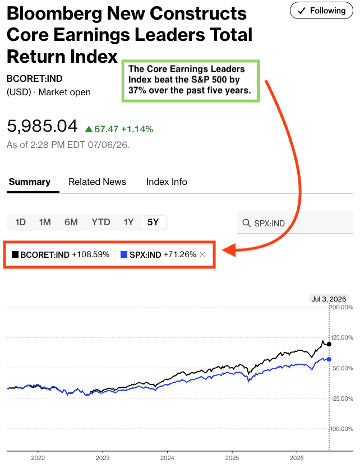
The Bloomberg New Constructs Core Earnings Leaders Index, which allocates based on Earnings Capture and Core Earnings, beat the S&P 500 by 37% over the past five years. The Index (ticker: BCORET:IND) was up 109% while the S&P 500 was up 71%.
Figure 4: Bloomberg New Constructs Core Earnings Leaders Index Outperforms S&P 500: Last 5 Years
Sources: Bloomberg as of July 3, 2026
Note: Past performance is no guarantee of future results.
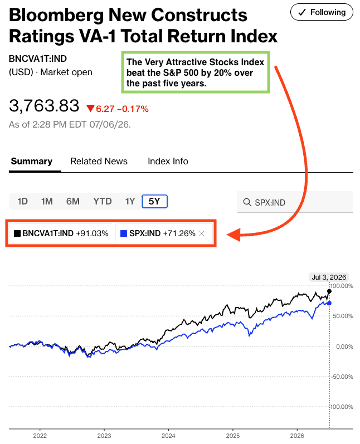
The “Very Attractive Stocks” Index, which allocates to stocks that get a Very Attractive rating by our AI Agent for Investing, beat the S&P 500 by 20% over the last five years. Bloomberg’s official name for the index is Bloomberg New Constructs Ratings VA-1Index (ticker: BNCVAT1T:IND). Figure 5 shows it was up 91% while the S&P 500 was up 71%.
Figure 5: Very Attractive-Rated Stocks Strongly Outperform the S&P 500: Last Five Years
Sources: Bloomberg as of July 3, 2026
Note: Past performance is no guarantee of future results.
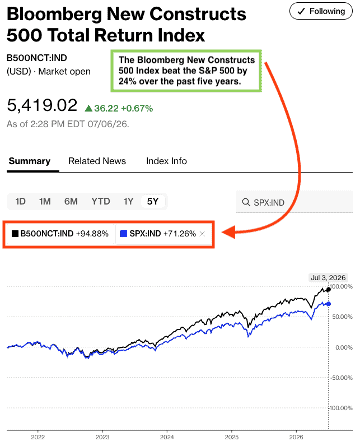
Our “Core-Earnings Weighted S&P 500” Index, which weights the largest 500 U.S. companies by Core Earnings instead of market cap, beat the S&P 500 by 24% over the past five years. Bloomberg’s official name for the index is Bloomberg New Constructs 500 Total Return Index (ticker: B500NCT:IND). Figure 6 shows it was up 95% while the S&P 500 was up 71%.
Figure 6: Bloomberg New Constructs 500 Index Strongly Outperforms the S&P 500: Last Five Years
Sources: Bloomberg as of July 3, 2026
Note: Past performance is no guarantee of future results.
This article was originally published on July 8, 2026.
Disclosure: David Trainer and Kyle Guske II receive no compensation to write about any specific stock, sector, style, or theme.
Questions on this report or others? Join our online community and connect with us directly.
[1] The Risk-Free Rate is based on the 3-month T-bill.