
The Operating Earnings from S&P Global (SPGI) for the S&P 500 overstate Core Earnings[1],[2] through 3Q21, which continue a trend from last quarter. We see the same problems with GAAP Earnings, as detailed here.
Stocks are more expensive than they appear, and, despite falling from prior highs, the S&P 500’s valuation depends on more earnings growth than analysts expect, which increases downside risk for the index.
Last quarter’s analysis of Core vs. Operating Earnings for the S&P 500 is here. Get all our reports on the trends in fundamentals of the market & each sector here.
Our research leverages more reliable fundamental data[3] that overcomes flaws with legacy fundamental datasets to provide a more informed view of the fundamentals of companies and a new source of alpha.
S&P Global’s Earnings Rebound Is Misleading
The rebound in earnings is not as robust as SPGI’s Operating Earnings suggest. Year-over-year (YoY):
- SPGI’s Operating Earnings improved from $123.37/share to $189.88/share, or 54%
- Core Earnings improved from $129.35/share to $180.31/share, or 39%
SPGI’s Operating Earnings for the S&P 500 were 5% below Core Earnings in 3Q20 and were 5% higher in 3Q21. SPGI’s Operating Earnings contained unusual gains/losses that led to the exaggerated decline and subsequent rebound in true profits as shown in Figure 1.
Figure 1: Core Earnings vs. SPGI Operating : 4Q19 – 3Q21[4]
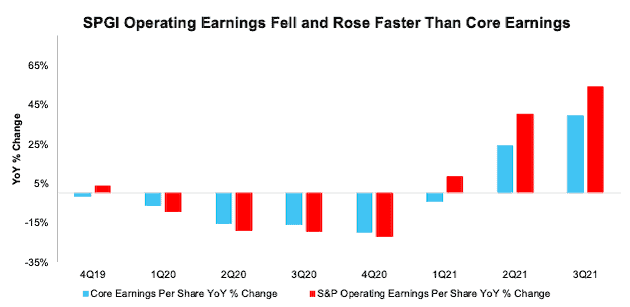
Sources: New Constructs, LLC, company filings, and S&P Global (SPGI). Note: the most recent period’s data for SPGI’s Operating Earnings is based on consensus estimates for companies with a non-standard fiscal year.
Our Core Earnings analysis is based on aggregated TTM data through 6/30/13 and aggregated quarterly data thereafter for the S&P 500 constituents in each measurement period. More details in Appendix I.
A Continued Rise In the S&P 500 Requires Commensurate Rise in Investor Optimism
Through 3Q21, Core Earnings for the S&P 500 reached new highs, surpassing last quarter’s already record levels. However, an even faster rise in the price of the S&P 500 (See Figure 2) stretches the gap between the S&P 500’s valuation and its true fundamentals.
As Operating Earnings continue to overstate the S&P 500’s Core Earnings, the index requires increasing investor optimism to support its valuation. If future Core Earnings growth does not catch up to current investor optimism, then the index could tumble.
While unusual income can boost EPS in the short term, they do not last forever. In the meantime, downside risk in the market grows as price gains outpace Core Earnings gains (more details in Figure 3 below).
Figure 2: Core Earnings vs. S&P 500 Price: 2004 to Present (through 11/16/21)
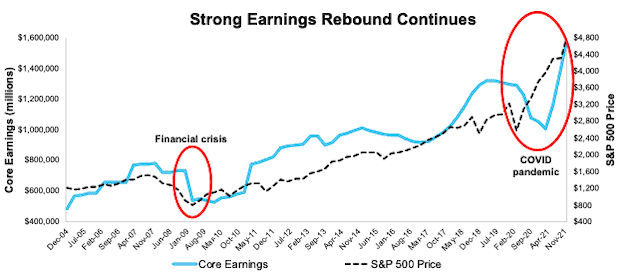
Sources: New Constructs, LLC, company filings, and S&P Global (SPGI).
Our Core Earnings analysis is based on aggregated TTM data through 6/30/13, and aggregated quarterly data thereafter for the S&P 500 constituents in each measurement period. More details in Appendix I.
S&P 500 Still Looks Expensive Compared to Historical Averages
Figure 3 shows the S&P 500 has rarely had a higher trailing P/E ratio based on Core Earnings or SPGI’s Operating Earnings. The P/E ratio based on Core Earnings of 25.1 is down slightly from 26.3 last quarter while the P/E ratio based on SPGI’s Operating earnings actually rose from 24.5 to 24.8 quarter-over-quarter.
Figure 3: Price-to-Core vs. Price-to-SPGI’s Operating Earnings: TTM 12/31/04 – Present (thru 11/16/21)
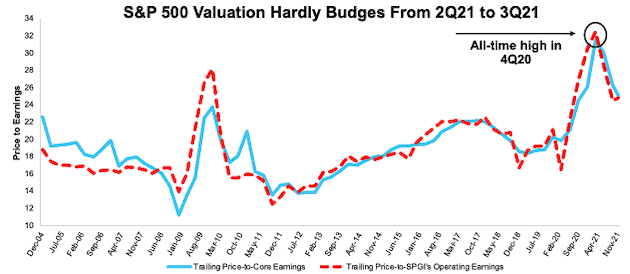
Sources: New Constructs, LLC, company filings, and S&P Global. Note: the most recent period’s data for SPGI’s Operating Earnings incorporates consensus estimates for companies with a non-standard fiscal year.Our Core Earnings P/E ratio is aggregating the TTM results for constituents through 6/30/13 and aggregating four quarters of results for the S&P 500 constituents in each measurement period thereafter. SPGI’s P/E is based on four quarters of aggregated S&P 500 results in each period. More details in Appendix II.
Core Earnings are a Less Volatile Measure of Earnings
Figure 4 highlights the percentage change in Core Earnings and SPGI’s Operating Earnings from 2004 to present. The differences are due to flaws in legacy fundamental datasets (detailed in The Journal of Financial Economics) that fail to capture the full impact of unusual gains/losses buried in footnotes.
Figure 4: Core vs. SPGI’s Operating Earnings Per Share for the S&P 500 – % Change: 2004 – 11/16/21
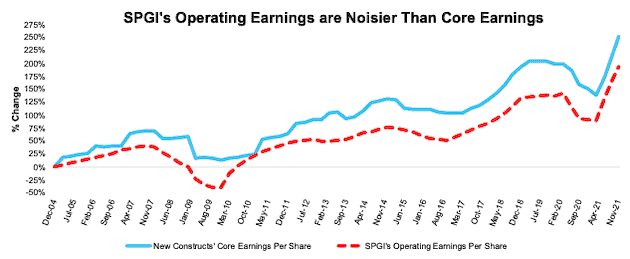
Sources: New Constructs, LLC, company filings, and S&P Global (SPGI). Note: the most recent period’s data for SPGI’s Operating Earnings incorporates consensus estimates for companies with a non-standard fiscal year.Our Core Earnings analysis is based on aggregated TTM data through 6/30/13, and aggregated quarterly data thereafter for the S&P 500 constituents in each measurement period.
An Example of Overstated Earnings in the S&P 500: Celanese Corp (CE)
Below, we detail the hidden and reported unusual items that aren’t captured in GAAP Earnings but are captured in Core Earnings for Celanese Corp (CE). We would be happy to reconcile our Core Earnings with Operating Earnings if S&P Global would disclose exactly how Operating Earnings differ from GAAP Earnings.
After adjusting for unusual items, we find that Celanese Corp’s Core Earnings of $12.40/share are 50% less than reported GAAP Earnings of $24.81/share.
Celanese Corp’s Earnings Distortion Score is Strong Miss. However, despite the likelihood to miss earnings in the short-term, given the company’s high ROIC and relatively cheap valuation, our overall stock rating, a more long-term view of risk/reward, for CE is Very Attractive.
Figure 5 details the differences between Core Earnings and GAAP Earnings so readers can audit our research.
Figure 5: Celanese Corp’s GAAP Earnings to Core Earnings Reconciliation: 3Q21

Sources: New Constructs, LLC and company filings.
More details:
Hidden Unusual Gains, Net = $0.03/per share, which equals $3 million and is comprised of
- $7 million gain on disposition of businesses and assets in 3Q21
- -$2 million in asset impairments in 3Q21
- -$2 million in accelerated depreciation expense in 1Q21
Reported Unusual Gains Pre-Tax, Net = $13.74/per share, which equals $1.6 billion and is comprised of
- $1.4 billion in reported other non-recurring income in the TTM period based on
- $11 million gain on disposition of businesses and assets in 3Q21
- $1.4 billion gain on sale of investments in affiliates in 4Q20
- $133 million in financing gains in the TTM period based on
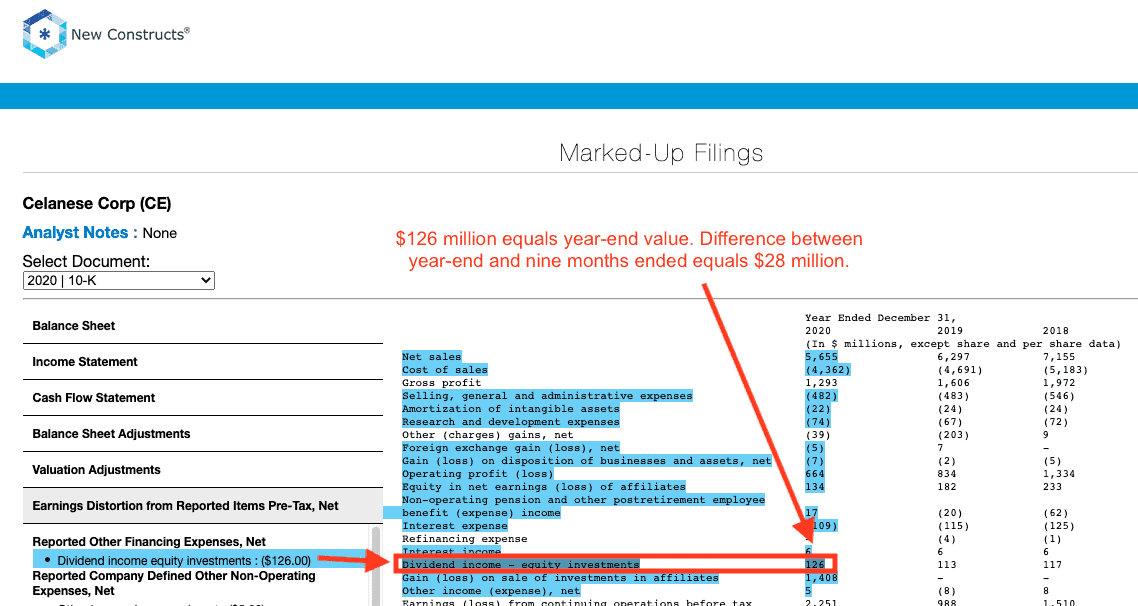
- $35 million in dividend income – equity investments in 3Q21
- -$9 million in refinancing expense in 3Q21
- $37 million in dividend income- equity investments in 2Q21
- $42 million in dividend income – equity investments in 1Q21
- $47 million in non-operating pension and other postretirement employee benefit income in the TTM period based on
- $37 million benefit in 3Q21
- $38 million benefit in 2Q21
- $38 million benefit in 1Q21
- -$66 million expense in 4Q20
- $27 million contra adjustment for recurring pension costs. These recurring expenses are reported in non-recurring line items, so we add them back and exclude them from Earnings Distortion.
- $5 million restructuring gains in the TTM period based on
- -$2 million restructuring charge in 2Q21
- -$2 million restructuring charge in 1Q21
- $9 million plant/office closure benefit in 1Q21
- -$1 million in foreign exchange loss in the TTM period passed on
- $2 million gain in 3Q21
- -$3 million loss in 2Q21
- $3 million gain in 1Q21
- -$3 million loss in 4Q20
- -$2 million in “other expense” in the TTM period based on
- -$2 million other expense in 3Q21
- $1 million other income in 2Q21
- -$2 million other expense in 1Q21
- $1 million other income in 4Q20
- -$13 million in reported write-downs in the TTM period based on
- -$1 million asset impairment in 2Q21
- -$5 million loss on disposition of businesses and assets in 1Q21
- -$1 million asset impairment in 1Q21
- -$6 million loss on disposition of businesses and assets in 4Q20
Tax Distortion = -$1.18/per share, which equals -$135 million
Reported Unusual Expenses After-Tax, Net = -$0.18/per share, which equals -$20 million and is comprised of
- -$20 million in losses from discontinued operations in the TTM period based on
- -$13 million loss in 3Q21
- -$4 million loss in 2Q21
- -$1 million loss in 1Q21
- -$2 million loss in 4Q20
How to Make Money with Core Earnings & Earnings Distortion
As demonstrated above, Core Earnings do a better job of excluding unusual gains and losses and provide a more reliable earnings measure. All Core Earnings adjustments are 100% transparent; so users can audit and trust the research.
To enable you to easily monetize our new Earnings Distortion factor we present multiple trading strategies that drive alpha. Learn more below.
- ExtractAlpha presents a long/short market-neutral strategy that generates 9.3% annualized return net of Fama-French 5 factors, momentum, short-term reversal, and 12 sectors. More details here.
- CloudQuant presents two strategies to monetize the alpha in Earnings Distortion:
- the long-only portfolio outperformed the S&P 500 by an average of 4% per annum over 10 years
- the dollar-neutral long-short portfolio returned 60% over 10 years with a Sharpe Ratio of ~1 over the last five years. More details here.
- AltHub presents three strategies to monetize the alpha in Earnings Distortion:
- Earnings Distortion S&P 500 Smart Beta Portfolio: 10-yr annualized return of 13.9% vs 12.1% for the S&P 500 with a Sharpe Ratio of 0.97.
- Earnings Distortion ML Model S&P 500 Smart Beta Portfolio: 3-yr annualized return of 18.2% vs 13.7% for the S&P 500 with a Sharpe Ratio of 0.82.
- Truth Stocks (Companies without Earnings Distortion) Portfolios:
- S&P 500 Universe: 10-yr annualized return of 16.8% vs 12.8% for the S&P 500 with a Sharpe Ratio of 0.7.
- Russell 3000 Universe: 9.5-yr annualized return of 28.4% vs 12.6% for the S&P 500 with a Sharpe Ratio of 1.
- More details here.
This article originally published on December 3, 2021.
Disclosure: David Trainer, Kyle Guske II, and Matt Shuler receive no compensation to write about any specific stock, style, or theme.
Follow us on Twitter, Facebook, LinkedIn, and StockTwits for real-time alerts on all our research.
[1] Only Core Earnings enable investors to overcome the flaws in legacy fundamental data and research, as proven in Core Earnings: New Data & Evidence, written by professors at Harvard Business School (HBS) & MIT Sloan for The Journal of Financial Economics.
[2] Our Core Earnings research is based on the latest audited financial data, which is the calendar 3Q21 10-Q in most cases. Operating Earnings from S&P Global is based on the same time frame.
[3] Three independent studies prove the superiority of our data, models, and ratings. Learn more here.
[4] November 16, 2021, is the earliest date for which all the calendar 3Q2 10-Qs for the S&P 500 constituents were available.