
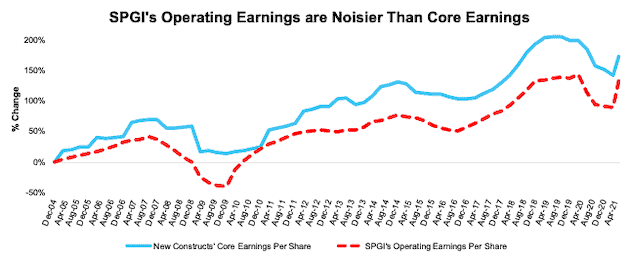
1Q21 Core Earnings[1][2] strongly rebounded from the 4Q20 lows, but not as strong as Operating Earnings from S&P Global (SPGI). In fact, our Core Earnings have been much less volatile over the last ~18 months than SPGI’s Operating Earnings as shown in Figure 1. The implication of this report is clear: the market needs a continued strong recovery in earnings to justify its valuation. The open questions are:
- which companies are overstating earnings to try and appease investors and
- which stocks will lead the market in 2Q21.
Finding Winners and Losers Is Key to Success in 2021
2021 has been a tale of two markets for most investors. While the overall S&P 500 is up strongly for the year, many of the big performing stocks over the last couple of years have been down. For example, Tesla (TSLA), Netflix (NFLX), Amazon (AMZN), Adobe Systems (ADBE),and Advanced Micro Devices (AMD) are all down year-to-date (YTD). Meanwhile, new stocks, such as Target (TGT), Williams-Sonoma (WSM), JPMorgan Chase (JPM), General Motors (GM), and Simon Property Group (SPG) are leading the market upward.
The key for investors for the rest of 2021 will be finding the stocks that will outperform going forward. We think the companies with the best Core Earnings, not reported or SPGI Operating Earnings, have the best chance to outperform. See Figure 6 for a list of stocks that we expect to outperform this year.
Figure 1: Core Earnings vs. SPGI Operating : December 2019 to Present (through 5/19/21[3])
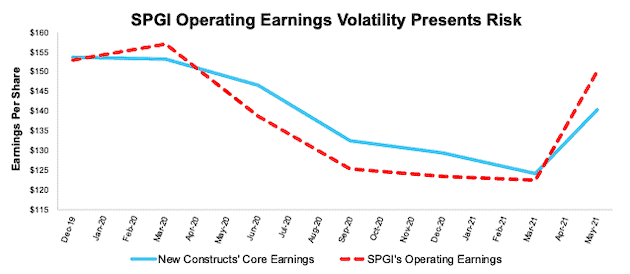
Sources: New Constructs, LLC, company filings, and S&P Global (SPGI). Note: the most recent period’s data for SPGI’s Operating Earnings is based on consensus.
Our Core Earnings analysis is based on aggregated TTM data through 6/30/13, and aggregated quarterly data thereafter for the S&P 500 constituents in each measurement period. More details in Appendix I.
S&P 500 Pricing In Major Earnings Recovery
Figure 2 shows how the S&P 500 price rise in 1Q21 was matched with a large increase in Core Earnings, contrary to prior quarters.
Figure 2 also illustrates how different the market’s response to the COVID-19 pandemic has been compared to the Financial Crisis in 2008/2009. During that crisis, the S&P 500’s price fell for multiple quarters and didn’t rebound until around the time Core Earnings bottomed. Today, the market fell largely in one quarter and has soared since then, well before Core Earnings rebounded.
The United States continues to make progress with its vaccine rollout and the reopening of economies around the globe bodes well for future earnings growth. We expect the rotation from overvalued growth stocks to Core Earnings-generating industry leaders will continue in 2021.
Figure 2: Core Earnings vs. S&P 500 Price: 2004 to Present (through 5/19/21[4])
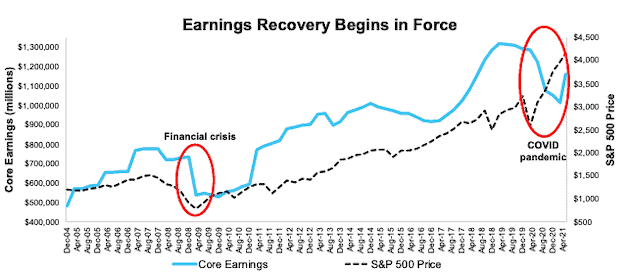
Sources: New Constructs, LLC, company filings, and S&P Global (SPGI).
Our Core Earnings analysis is based on aggregated TTM data through 6/30/13, and aggregated quarterly data thereafter for the S&P 500 constituents in each measurement period. More details in Appendix I.
S&P 500 Has Only Been This Expensive in Two Quarters Since 2004: 4Q20 & 3Q20
Figure 2 shows how the trailing price-to-earnings (P/E) ratios based on our Core Earnings and S&P Global’s (SPGI) operating earnings has fallen from all-time highs reached in 4Q20. Besides 4Q20, the S&P has only had a higher trailing P/E ratio (based on Core Earnings and SPGI’s Operating Earnings) in 3Q20, which indicates the market is still expecting a significant recovery in earnings.
Figure 3: Price-to-Core vs. Price-to-SPGI’s Operating Earnings: TTM 12/31/04 – Present (through 5/19/21)
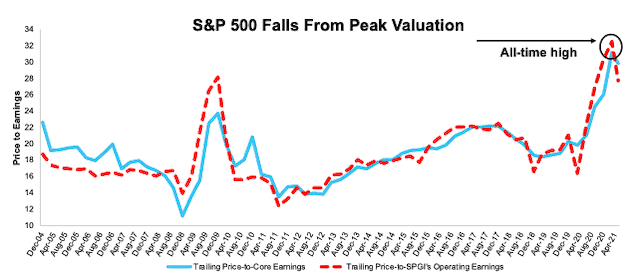
Sources: New Constructs, LLC, company filings, and S&P Global. Note: the most recent period’s data for SPGI’s Operating Earnings is based on consensus.
Our Core Earnings P/E ratio is aggregating the TTM results for constituents through 6/30/13 and aggregating four quarters of results for the S&P 500 constituents in each measurement period thereafter. SPGI’s P/E is based on four quarters of aggregated S&P 500 results in each period. More details in Appendix II.
The Earnings Rebound Is Here, But Not As Good As It Appears
1Q21 Core Earnings per share for the S&P 500 improved 13% quarter-over-quarter while 1Q21 S&P Global's Operating Earnings per share for the S&P 500 improved 23%. Year-over-year (YoY), Core Earnings per share remain down 4% while SPGI Operating Earnings per share are up 8%, largely due to the fact that SPGI Operating Earnings fell more drastically in 1Q20 than Core Earnings.
Figure 4 shows the difference between Core Earnings and SPGI’s Operating Earnings from 2004 to present. The differences are due to errors, omissions, and biases in legacy fundamental datasets (detailed in a paper in The Journal of Financial Economics) that fail to capture the full impact of unusual gains/losses buried in footnotes. Missing these unusual gains/losses causes earnings measures to be unreliable and subject to management manipulation.
Relying on legacy providers’ data can put investors at risk of not understanding the true trajectory of earnings at the company level and across the entire market.
Figure 4: Core Earnings vs. SPGI’s Operating Earnings Per Share: 2004 – Present (through 5/19/21)
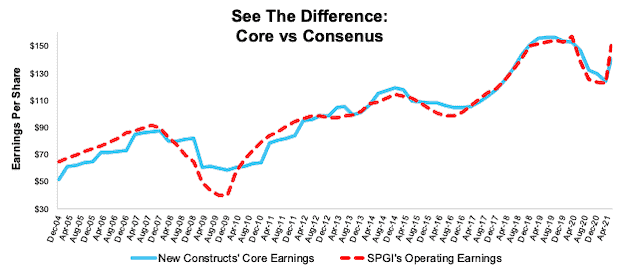
Sources: New Constructs, LLC, company filings, and S&P Global. Note: the most recent period’s data for SPGI’s Operating Earnings is based on consensus.
Our Core Earnings analysis is based on aggregated TTM data through 6/30/13, and aggregated quarterly data thereafter for the S&P 500 constituents in each measurement period.
Figure 5 charts the percentage change in our Core Earnings and SPGI’s operating earnings and clearly illustrates that SPGI’s operating earnings took a more pronounced decline during the financial crisis and have yet to align with Core Earnings.
Figure 5: Core vs. SPGI’s Operating Earnings Per Share for the S&P 500 – % Change: 2004 – 5/19/21
Sources: New Constructs, LLC, company filings, and S&P Global (SPGI). Note: the most recent periods’ data for SPGI’s Operating Earnings is based on consensus.
Our Core Earnings analysis is based on aggregated TTM data through 6/30/13, and aggregated quarterly data thereafter for the S&P 500 constituents in each measurement period.
Where to Put Your Money In an Expensive Market
We’ve recently identified numerous companies that look good post 1Q21 earnings. These companies, highlighted in Figure 6, provide attractive/risk reward and are undervalued by the market.
Figure 6: Long Ideas With Attractive Risk/Reward
| Company | Ticker | Recent Report Date |
| AutoZone | AZO | 5/26/21 |
| TJ Maxx | TJX | 5/26/21 |
| Walt Disney | DIS | 5/19/21 |
| Walmart | WMT | 5/19/21 |
| MasTec | MTZ | 5/12/21 |
| Lear Corp | LEA | 5/12/21 |
| Allstate Inc. | ALL | 5/12/21 |
| McDonald’s | MCD | 5/5/21 |
| Colgate-Palmolive | CL | 5/5/21 |
| Amgen Inc. | AMGN | 5/5/21 |
Sources: New Constructs, LLC and company filings.
This article originally published on June 2, 2021.
Disclosure: David Trainer, Kyle Guske II, Matt Shuler, Alex Sword, and Devyn DeLange receive no compensation to write about any specific stock, style, or theme.
Follow us on Twitter, Facebook, LinkedIn, and StockTwits for real-time alerts on all our research.
Appendix I: Core Earnings Methodology
In the Figures above, we use the following to calculate Core Earnings:
- aggregated annual data for constituents in the S&P 500 for each measurement period through 6/30/13
- aggregated quarterly data for constituents in the S&P 500 for each measurement period post 6/30/13 to the present
While we prefer aggregated quarterly numbers, we have examined the potential impacts of the two methodologies and have found no material differences.
Appendix II: P/E Ratio Methodology for Core & SPGI’s Operating Earnings
In Figure 2 above, we calculate the price-to-Core Earnings ratio through 6/30/13 as follows:
- Calculate a TTM earnings yield for every S&P 500 constituent
- Weight the earnings yields by each stock’s respective S&P 500 weight
- Sum the weighted earnings yields and take the inverse (1/Earnings Yield)
We calculate the price-to-Core Earnings ratio for periods post 6/30/13 as follows:
- Calculate a trailing four quarters earnings yield for every S&P 500 constituent
- Weight the earnings yield by each stock’s respective S&P 500 weight
- Sum the weighted earnings yields and take the inverse (1/Earnings Yield)
We use the earnings yield methodology because P/E ratios don’t follow a linear trend. A P/E ratio of 1 is “better” than a P/E ratio of 30, but a P/E ratio of 30 is “better” than a P/E ratio of -15. In other words, aggregating P/E ratios can result in a low multiple due the inclusion of just a few stocks with negative P/Es.
Using earnings yields solves this problem because a high earnings yield is always “better” than a low earnings yield. There is no conceptual difference when flipping from positive to negative earnings yields as there is with traditional P/E ratios.
By using quarterly data as soon as its available, we better capture the impact of changes to S&P 500 constituents on a quarterly basis. For example, a company could be a constituent in 2Q18, but not in 3Q18. This method captures the continuously changing nature of the S&P 500 constituency.
For all periods in Figure 2, we calculate the price-to-SPGI’s Operating Earnings ratio by summing the preceding 4 quarters of Operating Earnings per share and, then, dividing by the S&P 500 price at the end of each measurement period.
[1] Only Core Earnings enable investors to overcome the inaccuracies, omissions and biases in legacy fundamental data and research, as proven in Core Earnings: New Data & Evidence, a paper in The Journal of Financial Economics.
[2] Our Core Earnings research is based on the latest audited financial data, which is the 1Q21 10-Q for most companies. Operating Earnings from S&P Global is based on the same time frame.
[3] The earliest date that the 1Q21 10-Qs for all S&P 500 constituents were available.
[4] The earliest date 1Q21 10-Qs for the S&P 500 constituents were available.
2 replies to "S&P 500 Is Still Priced for Continued Earnings Rebound"
Hard to understand your pick of MTZ given your current report says you do not recommend buying it. Which is right – your blog or your standard reports for subscribers?
Jeff,
Our stock rating for MTZ currently is Neutral and is based on the firm’s valuation and historic business performance. However, we also consider other factors when we perform more in-depth analysis of a firm. Looking forward, we believe Mastec is positioned to benefit from government infrastructure spending, 5G growth, and growing EV demand over the long term. These factors give MTZ even more upside from current price levels. Thanks for the question!