Picking from the multitude of sector ETFs is a daunting task. In any given sector there may be as many as 46 different ETFs, and there are at least 186 ETFs across all sectors.
Why are there so many ETFs? The answer is: because ETF providers are making lots of money selling them. The large number of ETFs has little to do with serving investors’ best interests. Below are three red flags investors can use to avoid the worst ETFs:
- Inadequate liquidity
- High fees
- Poor quality holdings
I address these red flags in order of difficulty. Advice on How to Find the Best Sector ETFs is here. Details on the Best & Worst ETFs in each sector are here.
How To Avoid ETFs with Inadequate Liquidity
This issue is the easiest avoid, and my advice is simple. Avoid all ETFs with less than $100 million in assets. Low asset levels tend to mean lower volume in the ETF and larger bid-ask spreads.
How To Avoid High Fees
ETFs should be cheap, but not all of them are. The first step here is to know what is cheap and expensive.
To ensure you are paying at or below average fees, invest only in ETFs with an expense ratio below 0.54%, which is the average expense ratio of the 186 US equity sector ETFs I cover. Weighting the expense ratios by assets under management, the average expense ratio is lower at 0.32%. A lower weighted average is a good sign that investors are putting money in the cheaper ETFs.
Figure 1 shows the most and least expensive sector ETFs in the US equity universe based on total annual costs. ProShares provides 3 of the most expensive ETFs while Fidelity ETFs are among the cheapest.
Figure 1: 5 Least and Most-Expensive Sector ETFs
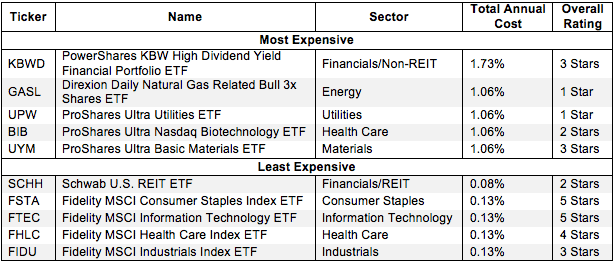 Sources: New Constructs, LLC and company filings
PowerShares KBW High Dividend Yield Financial Portfolio ETF (KBWD) and Direxion Daily Natural Gas Related Bull 3x Shares ETF (GASL) are two of the most expensive U.S. equity ETFs I cover, Schwab U.S. REIT ETF (SCHH) and Fidelity MSCI Industrials Index ETF (FIDU) are the least expensive. The more expensive KBWD receives my 3-star or Neutral rating, which is better than the cheaper SCHH, which receives my 2-star of Dangerous rating. Quality holdings can make up for high costs.
However, investors need not pay high fees for good holdings. Fidelity MSCI Consumer Staples Index ETF (FSTA) is my highest rated sector ETF and earns my Very Attractive rating. It also has low total annual costs of only 0.13%.
On the other hand, SCHH and FIDU hold poor stocks. No matter how cheap an ETF, if it holds bad stocks, its performance will be bad.
This result highlights why investors should not choose ETFs based only on price. The quality of holdings matters more than price.
How To Avoid ETFs with the Worst Holdings
This step is by far the hardest, but it is also the most important because an ETF’s performance is determined more by its holdings than its costs. Figure 2 shows the ETFs within each sector with the worst holdings or portfolio management ratings. The sectors are listed in descending order by overall rating as detailed in my 3Q Sector Ratings report.
Figure 2: Sector ETFs with the Worst Holdings
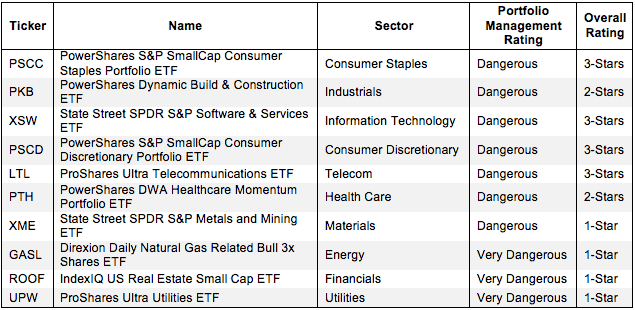 Sources: New Constructs, LLC and company filings
My overall ratings on ETFs are based primarily on my stock ratings of their holdings. My firm covers over 3000 stocks and is known for the due diligence done on each stock we cover.
PowerShares appears more often than any other providers in Figure 2, which means that they offer the most ETFs with the worst holdings. PowerShares DWA Healthcare Momentum Portfolio ETF (PTH) has the worst holdings of all Health Care ETFs. PSCC, PKB, and PSCD also have the worst holdings in their respective sectors.
Find the ETFs with the worst overall ratings on my ETF screener. More analysis of the Best Sector ETFs is here.
The Danger Within
Buying an ETF without analyzing its holdings is like buying a stock without analyzing its business and finances. As Barron’s says, investors should know the Danger Within. Put another way, research on ETF holdings is necessary due diligence because an ETF’s performance is only as good as its holdings’ performance.
PERFORMANCE OF ETF’s HOLDINGs = PERFORMANCE OF ETF
Best & Worst Stocks In these ETFs
Brandywine Realty Trust (BDN) is one of my least favorite stocks held by ROOF and earns my Very Dangerous rating. Over the past decade, BDN has grown after-tax profit (NOPAT) by less than 1% compounded annually. Over the same time frame, BDN’s return on invested capital (ROIC) has decreased from 9 % to 4%, placing it in the bottom quintile of all companies I cover. BDN has not generated positive economic earnings in any year of my model, which goes back to 1998. To justify its current price of ~$15.50/share, BDN must grow NOPAT by 8% compounded annually for the next 15 years. This expectation seems rather unlikely given the past decade of nearly zero NOPAT growth. Investors should stay away from BDN.
Oracle (ORCL) is one of my favorite holdings in FTEC and earns my Attractive rating. Over the past decade, ORCL has grown NOPAT by 17% compounded annually. ORCL has also maintained a high, stable ROIC of ~30% over the past four years. With $38 billion in excess cash on hand, ORCL has plenty of money to fund acquisitions or other investments in future growth opportunities. Despite its plentiful cash and track record of profit growth, the market has fairly low expectations for ORCL. At its current valuation of ~$40/share, ORCL has a price to economic book value (PEBV) ratio of just 1.2, which implies that the market expects ORCL to grow NOPAT by no more than 20% for the remainder of its corporate life. Those expectations seem too low and I think that the company will exceed them.
Kyle Guske II contributed to this article
Disclosure: David Trainer and Kyle Guske II receive no compensation to write about any specific stock, sector, or theme.