
The All Cap Blend style ranks third out of the twelve fund styles as detailed in my Style Rankings for ETFs and Mutual Funds report. It gets my Neutral rating, which is based on aggregation of ratings of 39 ETFs and 712 mutual funds in the All Cap Blend style as of October 15th, 2013. Prior reports on the best & worst ETFs and mutual funds in every sector and style are here.
Figure 1 shows the five best and worst-rated all-cap blend ETFs and Figure 2 ranks from best to worst the ten all-cap blend mutual funds that meet our liquidity standards. Not all All Cap Blend style ETFs and mutual funds are created the same. The number of holdings varies widely (from 4 to 3531). This variation creates drastically different investment implications and, therefore, ratings. The best ETFs and mutual funds allocate more value to Attractive-or-better-rated stocks than the worst, which allocate too much value to Neutral-or-worse-rated stocks.
To identify the best and avoid the worst ETFs and mutual funds within the All Cap Blend style, investors need a predictive rating based on (1) stocks ratings of the holdings and (2) the all-in expenses of each ETF and mutual fund. Investors need not rely on backward-looking ratings. My fund rating methodology is detailed here.
Investors seeking exposure to the All Cap Blend style should consider buying Schwab US Dividend Equity ETF (SCHD), the only All Cap Blend Style fund that earns an Attractive rating. If you must have more exposure to this style, you should buy a basket of Attractive-or-better rated stocks and avoid paying undeserved fund fees. Active management has a long history of not paying off. Here’s the list of our top-rated stocks.
Get my ratings on all ETFs and mutual funds in this style by searching for All Cap Blend on my free mutual fund and ETF screener.
Figure 1: ETFs with the Best & Worst Ratings – Top 5
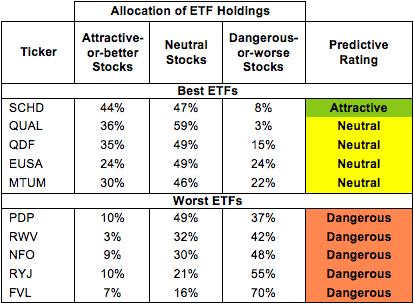 * Best ETFs exclude ETFs with TNAs less than $100 million for inadequate liquidity.
Sources: New Constructs, LLC and company filings
AdvisorShares TrimTabs Float Shrink ETF (TTFS) and FlexShares Northern Trust Quality Dividend Defensive Index (QDEF) are excluded from Figure 1 because their total net assets (TNA) are below $100 million and do not meet our liquidity minimums.
Figure 2: Mutual Funds with the Best & Worst Ratings – Top 5
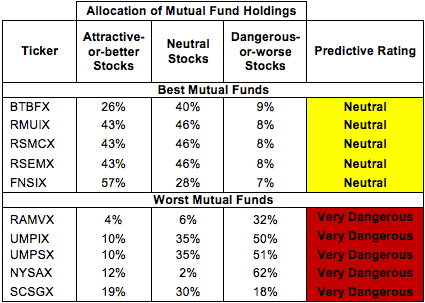 * Best mutual funds exclude funds with TNAs less than $100 million for inadequate liquidity.
Sources: New Constructs, LLC and company filings
Five funds are excluded from Figure 2 because their total net assets (TNA) are below $100 million and do not meet our liquidity minimums. Advisors Series Trust: Teberg Fund (TEBRX) is excluded from Figure 2 because 88% of its holdings are cash. Northern Lights Fund Trust II: AIS Tactical Asset Allocation Portfolio (TAPAX) and Northern Lights Fund Trust II: AIS Tactical Asset Allocation Portfolio (TAPCX) are excluded from Figure 2 because 69% of their holdings are cash.
Schwab US Dividend Equity ETF (SCHD) is my top-rated All Cap Blend ETF and Boston Trust & Walden Funds: Boston Trust Asset Management Fund (BTBFX) is my top-rated All Cap Blend mutual fund. SCHD earns my Attractive rating and BTBFX earns my Neutral rating.
First Trust Value Line 100 ETF (FVL) is my worst-rated All Cap Blend ETF and Northern Lights Fund Trust II: AIS Tactical Asset Allocation Portfolio (TAPAX) is my worst-rated All Cap Blend mutual fund. FVL earns my Dangerous rating and TAPAX earns my Very Dangerous rating.
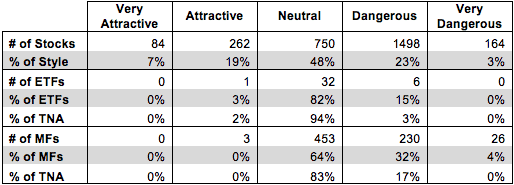
Figure 3 shows that 346 out of the 2758 stocks (over 26% of the market value) in All Cap Blend ETFs and mutual funds get an Attractive-or-better rating. However, only 1 out of 39 All Cap Blend ETFs (less than 2% of total net assets) and three All Cap Blend mutual funds (less than 1% of total net assets) get an Attractive-or-better rating.
The takeaways are: mutual fund managers allocate too much capital to low-quality stocks and All Cap Blend ETFs hold poor quality stocks
Figure 3: All Cap Blend Style Landscape For ETFs, Mutual Funds & Stocks
 Sources: New Constructs, LLC and company filings
As detailed in “Low-Cost Funds Dupe Investors”, the fund industry offers many cheap funds but very few funds with high-quality stocks, or with what I call good portfolio management.
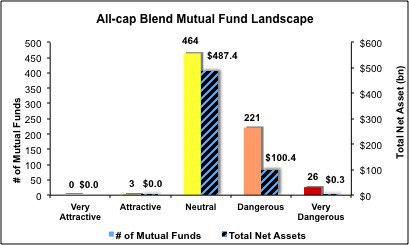
Investors need to tread carefully when considering All Cap Blend ETFs and mutual funds, as 98% of All Cap Blend style ETFs and 100% of All Cap Blend mutual funds earn a Neutral-or-worse rating. Only one ETF and three mutual funds in the All Cap Blend style allocate enough value to Attractive-or-better-rated stocks to earn an Attractive rating.
Amdocs Ltd. (DOX) is one of my favorite stocks held by All Cap Blend ETFs and mutual funds and earns my Very Attractive rating. Amdocs has grown after tax profits (NOPAT) by 36% compounded annually over the past 13 years. The company earns a return on invested capital (ROIC) of 11% and has generated positive economic earnings for the past ten years. Even with such a strong track record of profitability, DOX (at ~$37/share) trades at a price-to-economic book value (PEBV) ratio of 0.8. This ratio implies that the market expects the company’s NOPAT to permanently decline by 20%. Those overly pessimistic expectations create attractive risk/reward for DOX.
Hertz Global Holdings, Inc. (HTZ) is one of my least favorite stocks held by All Cap Blend ETFs and mutual funds and earns my Dangerous rating. Hertz Global Holdings has increased after-tax profits (NOPAT) by only 2% compounded annually over the last seven years. The company earns a 4th-quintile return on invested capital (ROIC) of 5% and has not generated positive economic earnings in the past seven years. To justify HTZ’s current stock price of ~$23, the company must grow profits (NOPAT) by 9% compounded annually over the next 17 years. These expectations seem too optimistic given the company’s recent low rate of profit growth and make HTZ a risky buy.
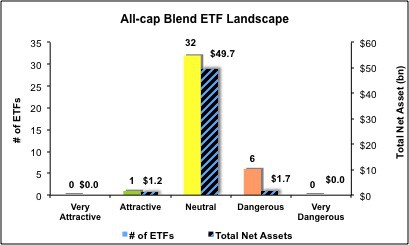
Figures 4 and 5 show the rating landscape of all All Cap Blend ETFs and mutual funds.
My Style Rankings for ETFs and Mutual Funds report ranks all styles and highlights those that offer the best investments.
Figure 4: Separating the Best ETFs From the Worst Funds
 Sources: New Constructs, LLC and company filings
Figure 5: Separating the Best Mutual Funds From the Worst Funds
 Sources: New Constructs, LLC and company filings
Review my full list of ratings and rankings along with reports on all 39 ETFs and 712 mutual funds in the All Cap Blend style.
Jared Melnyk contributed to this report.
Disclosure: David Trainer and Jared Melnyk receive no compensation to write about any specific stock, sector, style or theme.