The Large Cap Blend style ranks first out of the twelve fund styles as detailed in our 3Q16 Style Ratings for ETFs and Mutual Funds report. Last quarter, the Large Cap Blend style ranked second. It gets our Attractive rating, which is based on an aggregation of ratings of 35 ETFs and 859 mutual funds in the Large Cap Blend style as of July 28, 2016. See a recap of our 2Q16 Style Ratings here.
Figures 1 and 2 show the five best and worst rated ETFs and mutual funds in the style. Not all Large Cap Blend style ETFs and mutual funds are created the same. The number of holdings varies widely (from 16 to 3789). This variation creates drastically different investment implications and, therefore, ratings.
Investors seeking exposure to the Large Cap Blend style should buy one of the Attractive-or-better rated ETFs or mutual funds from Figures 1 and 2.
Figure 1: ETFs with the Best & Worst Ratings – Top 5

* Best ETFs exclude ETFs with TNAs less than $100 million for inadequate liquidity.
Sources: New Constructs, LLC and company filings
SPDR MSCI USA Strategic Factors ETF (QUS), and SPDR MFS Systematic Core Equity ETF (SYE) are excluded from Figure 1 because their total net assets (TNA) are below $100 million and do not meet our liquidity minimums.
Figure 2: Mutual Funds with the Best & Worst Ratings – Top 5

* Best mutual funds exclude funds with TNAs less than $100 million for inadequate liquidity.
Sources: New Constructs, LLC and company filings
State Street SPDR Dow Jones Industrial Average ETF (DIA) is the top-rated Large Cap Blend ETF and Nuveen Concentrated Core Fund (NCARX) is the top-rated Large Cap Blend mutual fund. Both earn a Very Attractive rating.
PowerShares Russell 1000 Equal Weight Portfolio (EQAL) is the worst rated Large Cap Blend ETF and Virtus Equity Trend Fund (VAPAX) is the worst rated Large Cap Blend mutual fund. EQAL earns a Neutral rating and VAPAX earns a Very Dangerous rating.
Wells Fargo & Company (WFC: $48/share) is one of our favorite stocks held by CBBZX and earns an Attractive rating. WFC was a featured Long Idea in October 2015. Over the past decade, Wells Fargo’s after-tax profit (NOPAT) has grown by 11% compounded annually. The company has improved its return on invested capital (ROIC) from 8% in 2010 to 10% over the last twelve months and has generated an astounding cumulative $38 billion in free cash flow over the last five years. Despite the fundamental strength, the market currently undervalues WFC. At its current price of $48/share, WFC has a price-to-economic book value (PEBV) ratio of 1.0. This ratio means that the market expects WFC’s NOPAT to never meaningfully grow from current levels. If WFC can grow NOPAT by just 4% compounded annually for the next decade, the stock is worth $63/share today – a 31% upside.
Brady Corporation (BRC: $33/share) is one of our least favorite stocks held by WBDNX and earns a Very Dangerous rating. BRC is on July’s Most Dangerous Stocks list. Over the past decade, BRC’s NOPAT has declined by 2% compounded annually. The company’s ROIC has fallen from a once impressive 13% in 2005 to 5% over the last twelve months. Despite the deterioration in fundamentals, BRC is up over 40% YTD, which makes shares significantly overvalued. To justify its current price of $33/share, BRC must grow NOPAT by 13% compounded annually for the next 13 years. This expectation seems rather optimistic given the past decade of profit decline.
Figures 3 and 4 show the rating landscape of all Large Cap Blend ETFs and mutual funds.
Figure 3: Separating the Best ETFs From the Worst Funds
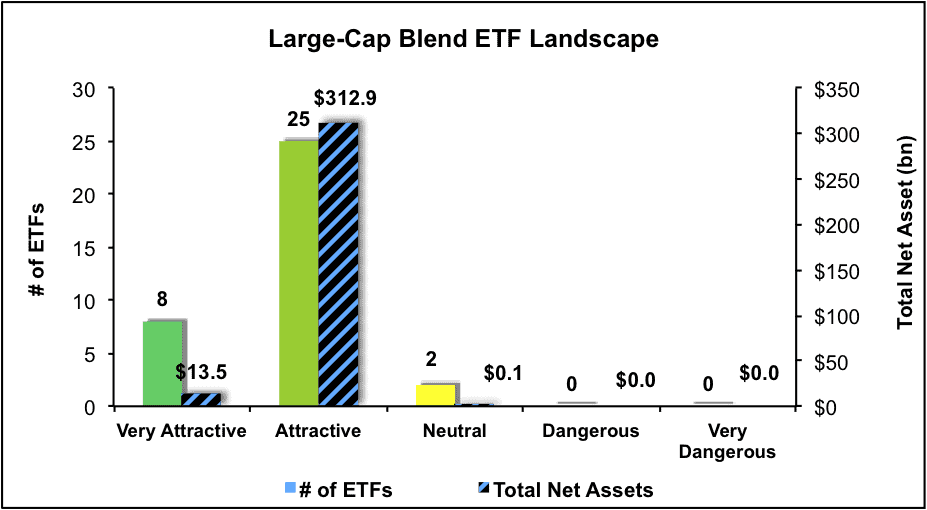
Sources: New Constructs, LLC and company filings
Figure 4: Separating the Best Mutual Funds From the Worst Funds
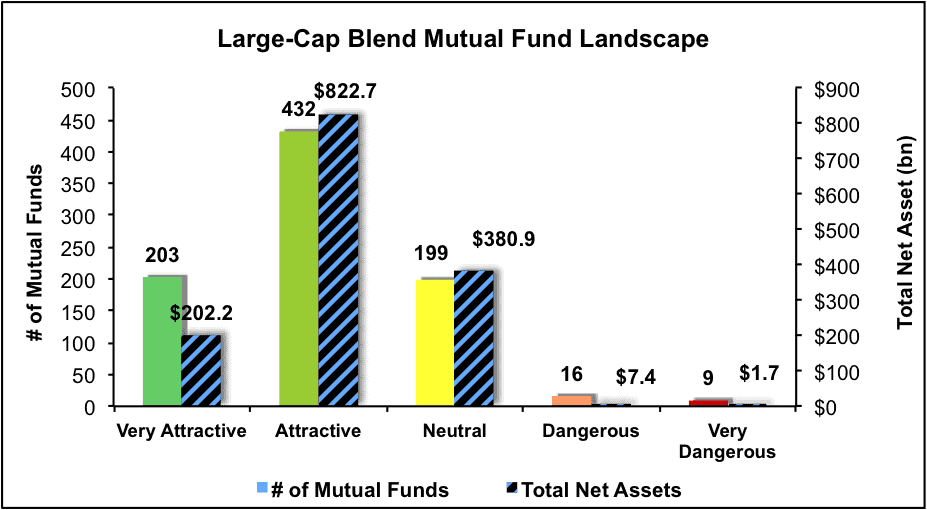
Sources: New Constructs, LLC and company filings
This article originally published here on July 28, 2016.
Disclosure: David Trainer and Kyle Guske II receive no compensation to write about any specific stock, style, or theme.
Click here to download a PDF of this report.