
Corporate managers appear to be using COVID-19 as a justification for writing down assets in unusually large amounts, aka the “kitchen sink” effect. We’re seeing the effect in large and small cap companies.
The Wall Street Journal features our research on the magnitude of asset impairments in the first half of 2020 as compared to the last twenty years in Company Write-Downs Surge as Business Slows During Covid-19.
This research leverages our Robo-Analyst technology to shine a light in the dark corners of financial filings (i.e. footnotes) and provide clients with more accurate measures of earnings as proven by a recent study from Harvard Business School and MIT Sloan.
S&P 500 1H2020: Write-Downs Thus Far in 2020 Are 27% Higher than All of 2019
The total value of pre-tax[1] write-downs for the S&P 500 thus far in 2020 is ~$185 billion, or 127% of the total in 2019. Our analysis shows write-downs tend to spike when stock markets and economic growth sink as they did during the financial crisis of 2008 and the economic turbulence in 2015.
We only have S&P 500 mappings back to 2004. Our data on All Cap and Small Cap stocks go back to 1998.
Figure 1: S&P 500: Total Write-Downs Pre-Tax: 2004 through First Half of 2020
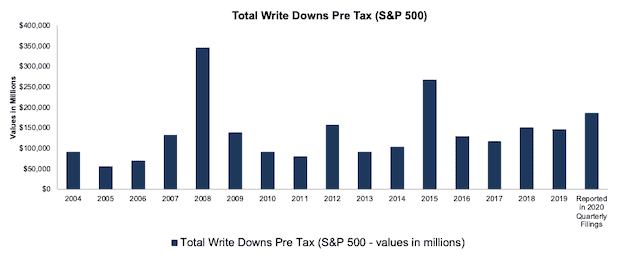
Sources: New Constructs, LLC, and company filings
S&P 500 1H2020: Write-Downs by Quarter
In 2020 Q1, the value of pre-tax write-downs disclosed was ~$105 billion, or 72% of the total for 2019 for the S&P 500. Since then, we’ve collected another $80 billion in pre-tax write-downs for the S&P 500.
Figure 2: S&P 500: Write-Downs in 2019 vs 1Q20 and 2Q20
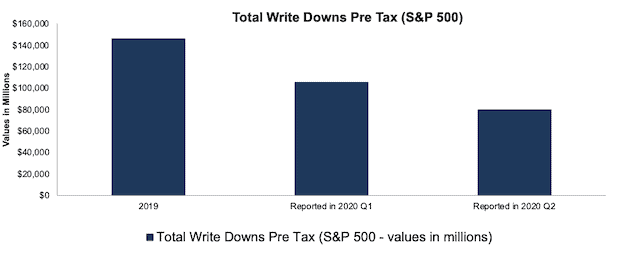
Sources: New Constructs, LLC, and company filings
S&P 500: Write-Downs In 1H2020 vs 1H2019
Pre-tax write-downs in the first half of 2020 totaled ~$185 billion or 153% more than the total pre-tax value of write downs in the first half of 2019 for the S&P 500.
Figure 3: S&P 500: Write-Downs in First Half of 2019 vs 2020
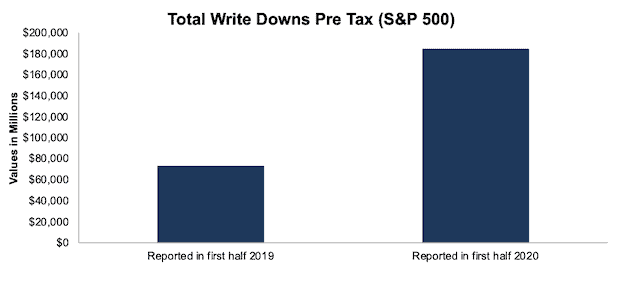
Sources: New Constructs, LLC, and company filings
Small Cap Companies: 1H2020: Write-Downs Thus Far in 2020 Are 83% Higher than All of 2019
The total value of pre-tax write-downs for small cap companies thus far in 2020 is ~$107 billion, or 183% of the total in 2019. Going back to the tech bubble, our analysis shows write-downs tend to spike when stock markets and economic growth flag.
The NC 1500 Small Cap index represents the aggregated results for the smallest 1500 companies by market cap in our NC 2000 All Cap index for each period. The list changes in each period based on the market caps of the companies in each period.
Figure 4: NC 1500 Small Cap: Total Write-Downs Pre-Tax: 1998 through First Half of 2020
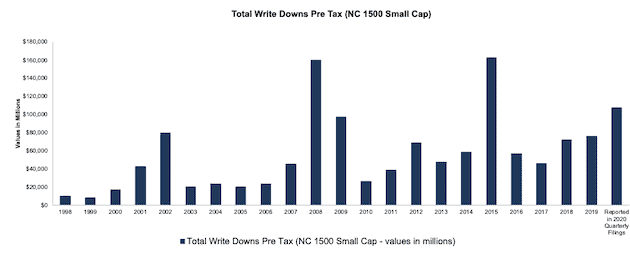
Sources: New Constructs, LLC, and company filings
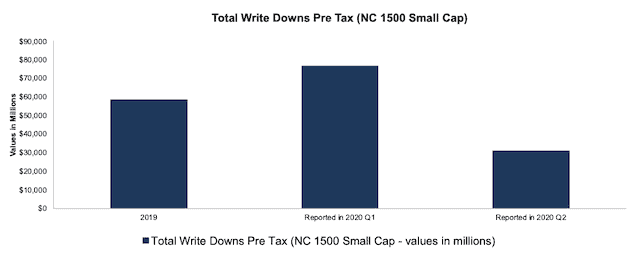
Small Cap Companies: 1H20: Massive Charges in 2020 Q1
In 2020 Q1, the value of pre-tax write-downs disclosed was ~$77 billion or 131% of the total for 2019 for small cap companies. Since then, we’ve collected another $31 billion in pre-tax write-downs for small cap companies.
Figure 5: NC 1500 Small Cap: Write-Downs in 2019 vs 1Q20 and 2Q20
Sources: New Constructs, LLC, and company filings
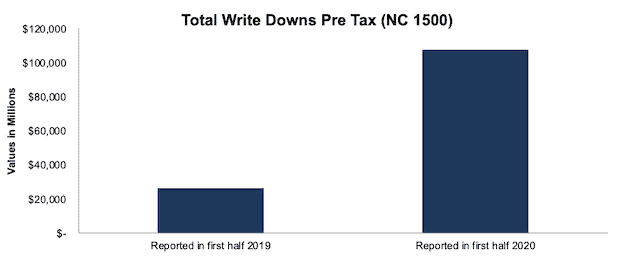
NC 1500 Small Cap: Write-Downs In 1H2020 vs 1H2019
Pre-tax write-downs in the first half of 2020 totaled ~$107 billion or 313% more than the total pre-tax value of write downs in the first half of 2019 for small cap companies.
Figure 6: NC 1500 Small Cap: Write-Downs in First Half of 2019 vs First Half of 2020
Sources: New Constructs, LLC, and company filings
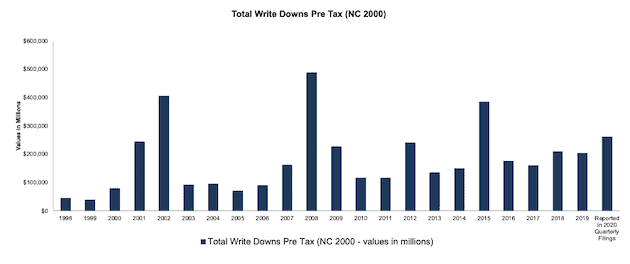
All Cap Analysis: 1H2020: Write-Downs Thus Far 2020 Are 29% Higher than All of 2019
The total value of pre-tax write-downs for our all cap index thus far in 2020 is ~$261 billion, or 129% of the total in 2019. Going back to the tech bubble, our analysis shows write-downs tend to spike when stock markets and economic growth sink.
The NC 2000 All Cap index represents the aggregated results for the largest 2000 companies by market cap in our coverage universe for each period. The list changes in each period based on the market caps of the companies in each period.
Figure 7: NC 2000 All Cap: Total Write-Downs Pre-Tax: 1998 through First Half of 2020
Sources: New Constructs, LLC, and company filings
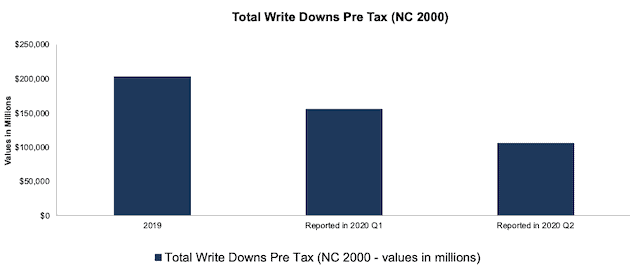
All Cap Analysis: 1H2020: Write-Downs by Quarter
In 2020 Q1, the value of pre-tax write-downs disclosed was ~$156 billion or 77% of the total for 2019 for our all cap index. Since then, we’ve collected another $106 billion in pre-tax write-downs for our all cap index .
Figure 8: NC 2000 All Cap: Write-Downs in 2019 vs 1Q20 and 2Q20
Sources: New Constructs, LLC, and company filings
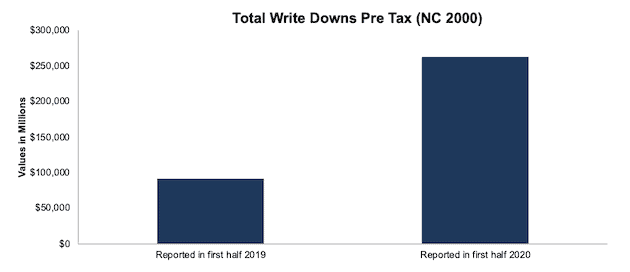
All Cap Analysis: Write-Downs In 1H2020 vs 1H2019
Pre-tax write-downs in the first half of 2020 totaled ~$262 billion or 188% more than the total pre-tax value of write downs in the first half of 2019 for our all cap index.
Figure 9: NC 2000 All Cap: Write-Downs in First Half of 2019 vs 2020
Sources: New Constructs, LLC, and company filings
This article originally published on August 20, 2020.
Disclosure: David Trainer, Kyle Guske II, and Matt Shuler receive no compensation to write about any specific stock, sector, style, or theme.
Follow us on Twitter, Facebook, LinkedIn, and StockTwits for real-time alerts on all our research.
[1] This report focuses on “pre-tax” values though we also have the after-tax values for all views presented.