
The Price to Earnings (P/E) ratio is in the Danger Zone this week. Check out this week’s Danger Zone Interview with Chuck Jaffe of Money Life and Marketwatch.com.
Its pleasing simplicity and ease of application make the P/E ratio one of the most commonly used valuation metrics in the world. Almost every financial website, from Bloomberg to Google Finance, puts the P/E near the top of the page, right near the stock price and market cap. Investors constantly reference the P/E ratio when making a bullish or bearish case for a stock.
However, the vast majority of evidence suggests that P/E ratios are an unreliable way to measure the true value of stocks. There are several reasons for this misconception, including:
Accounting Rules Are a Moving Target
The earnings denominator of the P/E ratio is subject to accounting rules that are constantly being reshaped. Former Financial Accounting Standards Board (FASB) chairman Bob Herz expressed this sentiment to us when we spoke to him last year, saying:
“I’m not a big fan of earnings multiples, of P/E multiples and things like that. We have made over time dramatic changes in the accounting that affect the denominator of the P/E ratio, but it’s not clear whether and how that flows through the valuations.”
The changing treatment of employee stock options is an example of how accounting rule changes affect reported earnings and make P/E’s between different stocks incomparable. One of the biggest in recent history was the 2006 FASB decision to require companies to report the cost of stock options on their income statements. This change officially went into effect in 2006. Unofficially, many companies reported stock option expense years in advance of the ruling.
For instance, Microsoft (MSFT) began expensing stock-based compensation in 2004. This expense lowered MSFT’s reported earnings decline by $1.8 billion in 2004 and made MSFT’s P/E incomparable to all other stocks that were not reporting their stock option expense.
Because companies have different fiscal year ends, the date they are required to follow new accounting rules is different too. So, at any given time, the EPS of some companies reflect the rule change while many others do not.
Accounting Earnings Are Often Misleading
Accounting earnings are based on rules designed for debt investors, not equity investors. They contain numerous loopholes that allow companies to inflate earnings. It takes diligent research in the financial footnotes in order to convert reported earnings to economic earnings.
AT&T (T) is one example of a stock with a P/E that is based on artificially inflated accounting earnings. T earned nearly $8 billion in non-operating income from its pension plan assets in 2013. This non-operating income allowed T to more than double its reported earnings in 2013. T’s artificially high earnings gave it a low P/E of 10.
In reality, T’s NOPAT actually declined by 5%. While the stock isn’t hugely expensive, it does have roughly 30% profit growth priced into its valuation. Investors who just look at the P/E get a misleading view of the stock’s valuation.
P/E Overlooks Key Liabilities And Assets
A stock’s worth is based on the present value of future cash flows attributable to the shareholder. Accounting earnings do a poor job of measuring cash flows, as we’ve already established. However, the other big flaw with P/E ratios is that they don’t account for many of the more senior claims on cash flows.
T exemplifies this issue as well as it has nearly $35 billion in deferred tax liabilities.
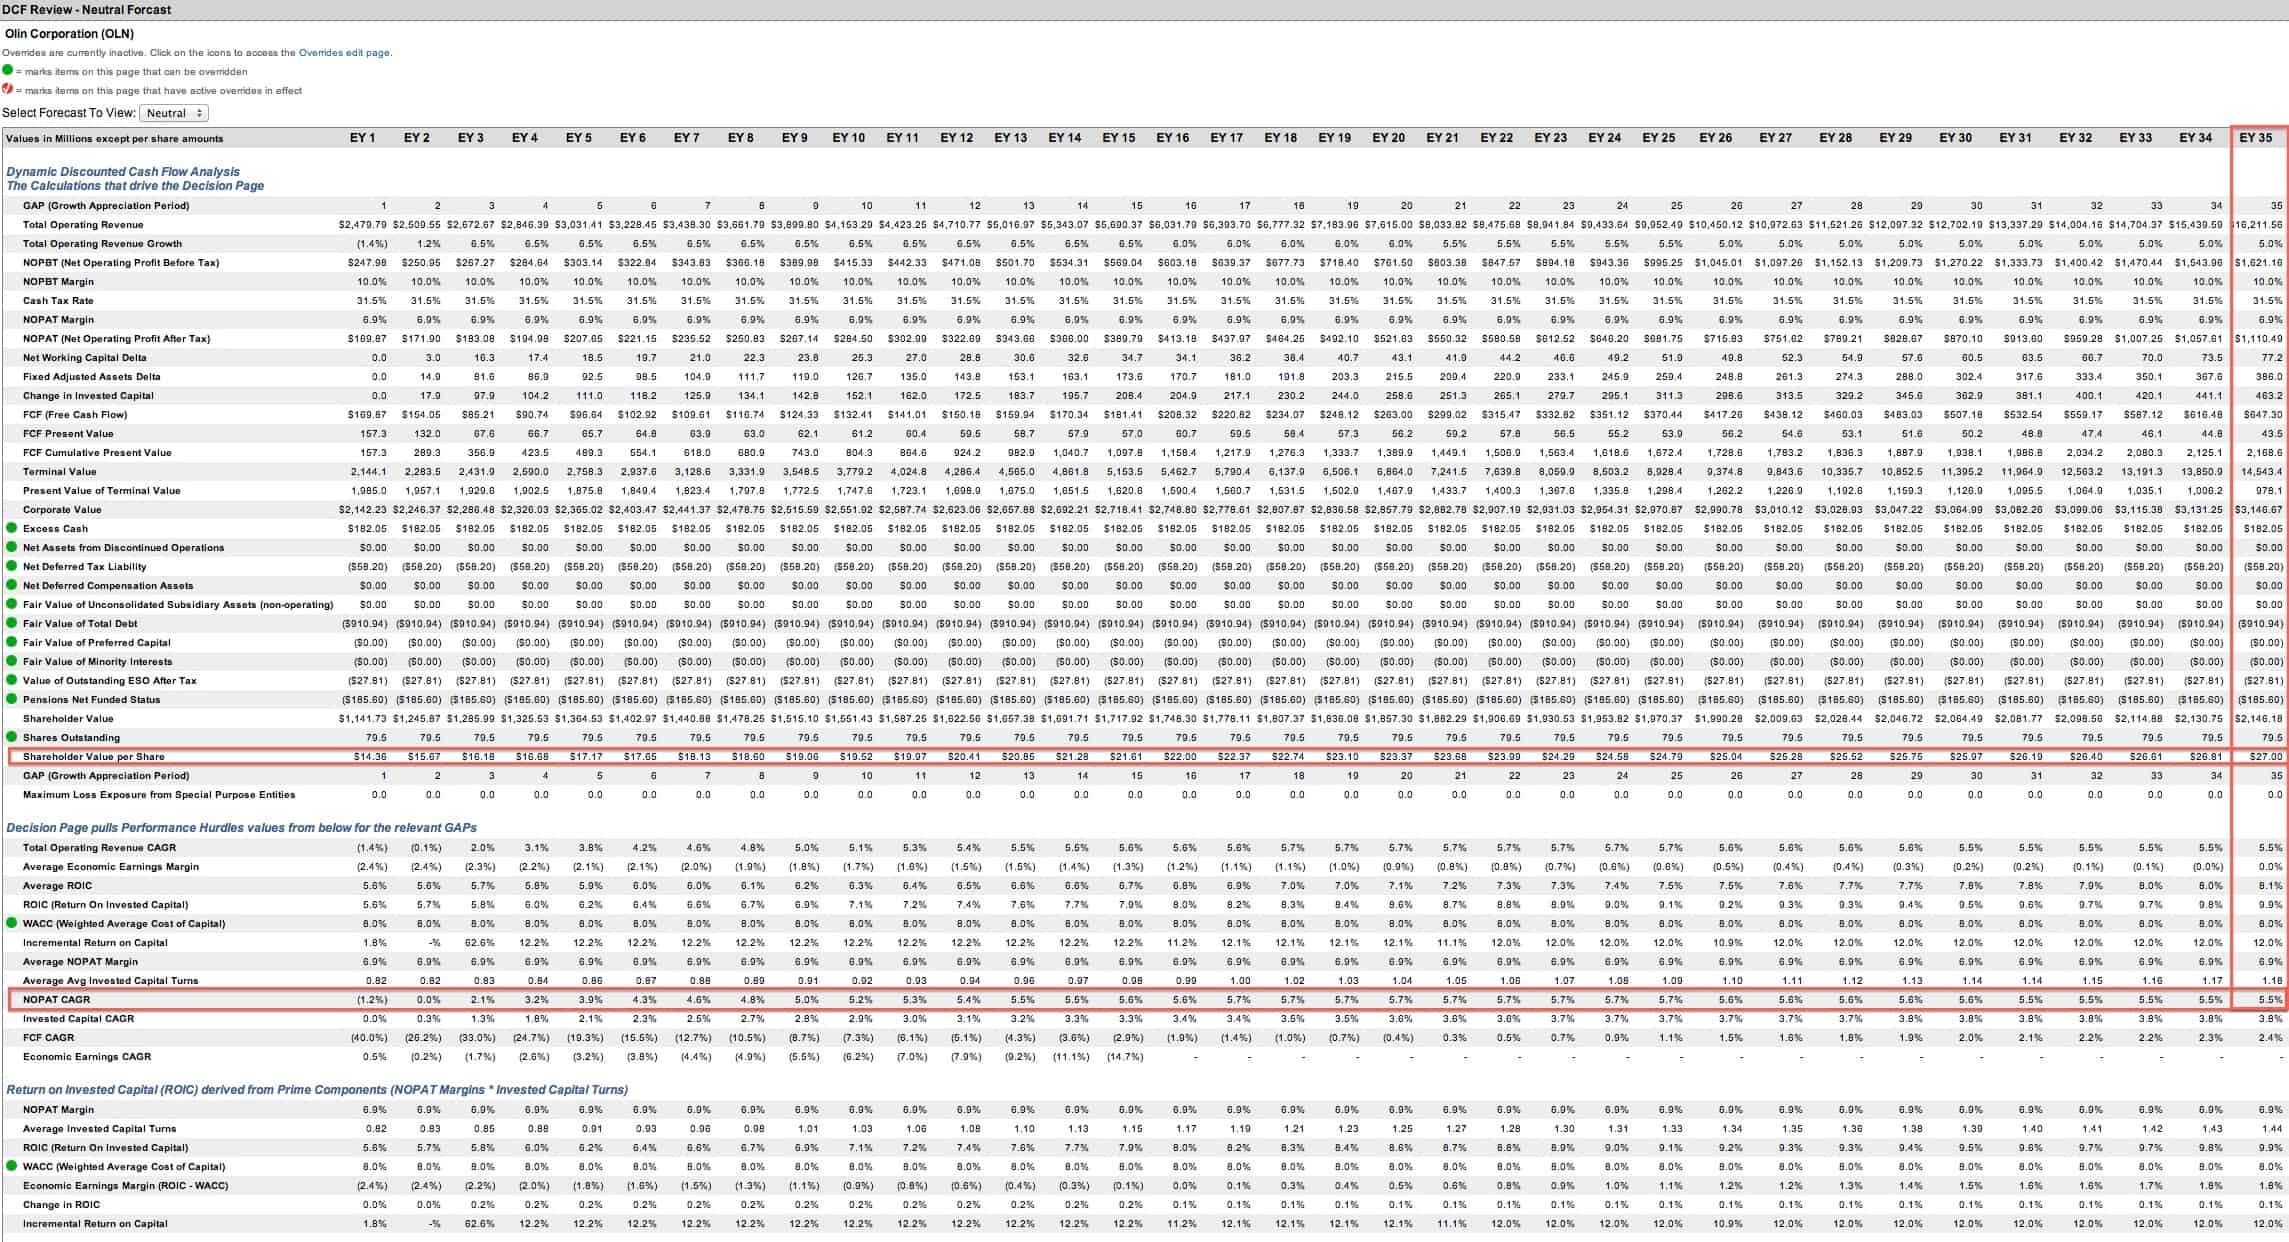
Olin Corporation (OLN) also exemplifies this issue. OLN looks cheap with a P/E of 13. However, it has off balance sheet debt, pension, and other liabilities that add up to ~$500 million (25% of market cap). With a discounted cash flow model, we can see that its current valuation of ~$27/share implies that OLN will grow NOPAT by 5.5% compounded annually for 35 years. Only with a real grasp on the true cash flows of the business can one get an accurate measure of the future cash flow growth implied by the stock’s valuation.
Here’s a list of the accounting distortions (see section C) we reverse for our valuation models.
The Market Cares More About ROIC
If markets moved on accounting earnings, there should be a strong correlation between earnings-per-share growth and shareholder returns. For all the reasons listed above, the correlation between these two factors is actually very weak, as demonstrated by Tim Koller, Jack Murrin, and Thomas E. Copeland in Valuation: Measuring and Managing the Value of Companies (p. 80).
Instead, we find a strong correlation between economic earnings and shareholder returns. Figure 1 shows that the difference between return on invested capital (ROIC) and weighted average cost of capital (WACC), also known as the economic earnings margin, explains 67% of the changes in valuations between stocks in the S&P 500[1].
Figure 1: Economic Earnings Drive Valuations For S&P 500 Companies
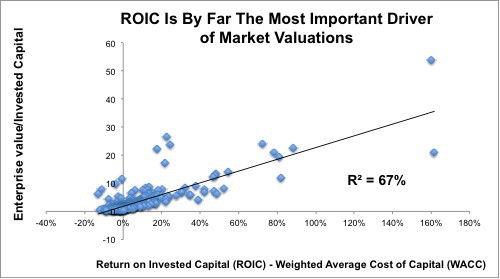 Sources: New Constructs, LLC and company filings.
Growing accounting earnings does not create shareholder value. Quarterly earnings beats might generate short-term price gains, but long-term value comes from earning an ROIC above WACC. This concept is not new. Back in the mid 1990s, many academics and analysts highlighted the superiority of cash on cash returns as drivers of valuation. Michael Mauboussin’s Plus Ça Change, Plus C’est Pareil, published by Credit Suisse in 1995, was one of the very first Wall Street research reports to feature ROIC as the preeminent driver of stock market valuation.
Important work like Mauboussin’s and others was thrust to the sidelines as the tech bubble consumed the hearts and minds of so many investors. It seems that investors have yet to come back around to recognizing the importance of ROIC and economic earnings (aka economic value added of “EVA”) as there have been too many distractions (e.g. tips from expert networks, early access to market-moving information, momentum trading trends). These distractions from the underlying economics promise quick, short-term gains that most investors find too appealing to ignore despite the lack of long-term significance or potential illegality. Recently, however, I see a reversal in this trend, which has lasted about twenty years. Diligence matters more and more these days.
Beware These P/E Traps
Several recent entries in the Danger Zone have looked cheap on a P/E basis. We already mentioned OLN above. On top of its hidden liabilities, OLN has inflated accounting earnings due to non-operating items buried in the footnotes.
In addition, Hawaiian Electric (HE) looks cheap at a P/E of 14, but its significant debt and deferred tax liabilities combine to $2.4 billion, which is the same as the total market cap of the company. HE’s P/E understates the significant growth in cash flows required to justify its valuation.
NCR Corporation (NCR) encompasses all the above issues. Non-operating items buried in the footnotes inflate its accounting earnings. Off balance sheet debt and underfunded pensions equal 10% of NCR’s market cap. Acquisitions have increased NCR’s accounting earnings while decreasing economic earnings.
P/E ratios are popular because they are simple and easy to understand, but investing is not supposed to be easy. Valuing companies takes diligence.
Sam McBride contributed to this report.
Disclosure: David Trainer is short NCR, HE and OLN. David Trainer and Sam McBride receive no compensation to write about any specific stock, sector, or theme.
[1] Note that the above regression analysis is based on the 489 companies in the S&P 500 that we cover except for Lorillard (LO). Because of its super high ROIC, including LO in the regression drives the r-squared up to 94%.