For the week of 7/27/20-7/31/20, we focus on the Earnings Distortion Scores for 206 companies.
Our Earnings Distortion Scores[1] empower investors to make smarter investments with superior data as well as defend against management efforts to obfuscate financial performance.
Our proprietary measure of earnings distortion (as featured on CNBC Squawk Box) leverages proprietary data featured in Core Earnings: New Data & Evidence. This paper shows that our adjusted core earnings are:
- more accurate than “Operating Income After Depreciation” and “Income Before Special Items” from Compustat, owned by S&P Global (SPGI) and
- remove significant bias from IBES Street Earnings from Refinitiv, owned by owned by Blackstone (BX) and Thomson Reuters (TRI).
COVID-19 is not disrupting our data collection and research. Our Robo-Analyst is more effective than ever.
Weekly Earnings Distortion Insights
Figure 1 contains the 15 largest (by market cap) companies that earn a “Strong Beat” or “Strong Miss” Earnings Distortion Score and are expected to report the week of July 27, 2020.
Figure 1: Earnings Distortion Scorecard Highlights: Week of 7/27/20-7/31/20
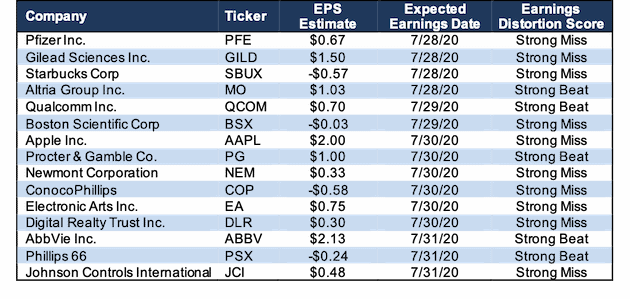
Sources: New Constructs, LLC and company filings
The appendix shows the Earnings Distortion Scores for all the S&P 500 companies, plus those with market caps greater than $10 billion, that are expected to report the week of July 27, 2020.
Details: Procter & Gamble Co. (PG): Earnings Distortion Score: Strong Beat
Over the trailing-twelve months (TTM), Procter & Gamble has -$7.0 billion in net earnings distortion that cause earnings to be understated by $2.77/share. Notable unusual expenses hidden and reported in Procter & Gamble’s filings include:
- $8.3 billion goodwill and indefinite-lived intangible impairment charge reported on the income statement – 2019 10-K
- $521 million in restructuring charges recorded in cost of products sold – 2019 10-K page 45
- $213 million in restructuring charges recorded in SG&A – 2019 10-K page 45
In addition, we made a $1.3 billion adjustment for income tax distortion. This adjustment normalizes reported income taxes and removes the impact of unusual or less persistent items on the taxes applied to core earnings.
In total, we identified $2.77/share (149% of GAAP EPS) in net unusual expense that cause Procter & Gamble’s TTM GAAP results to be understated. After removing this earnings distortion, Procter & Gamble’s TTM core earnings of $4.63/share are greater than GAAP EPS of $1.86, per Figure 2.
With understated earnings, Procter & Gamble gets our “Strong Beat” Earnings Distortion Score and is likely to beat consensus expectations.
Figure 2: Procter & Gamble Core Earnings Vs. GAAP: 2016 - TTM
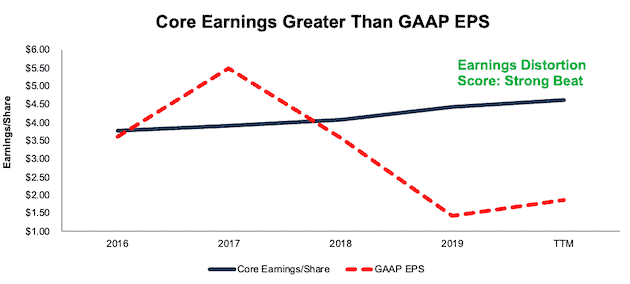
Sources: New Constructs, LLC and company filings
Figure 1 shows that Procter & Gamble is one of five companies that earn our “Strong Beat” score for this week.
How to Make Money with Earnings Distortion Data
“Trading strategies that exploit {adjustments provided by New Constructs} produce abnormal returns of 8% per year.” – Page 1 in Core Earnings: New Data & Evidence
In Section 5.2, professors from HBS & MIT Sloan present a long/short strategy that holds the stocks with the most understated EPS and shorts the stocks with the most overstated earnings.
This strategy produced abnormal returns of 8% a year. Click here for more details on our data offerings.
We Provide 100% Audit-ability & Transparency
Clients can audit all of the unusual items used in our calculations in the Marked-Up Filings section of each of our Company Valuation models. We are 100% transparent about what goes into our research because we want investors to trust our work and see how much goes into building the best earnings quality and valuation models.
This article originally published on July 20, 2020.
Disclosure: David Trainer, Kyle Guske II, and Matt Shuler receive no compensation to write about any specific stock, sector, style, or theme.
Follow us on Twitter, Facebook, LinkedIn, and StockTwits for real-time alerts on all our research.
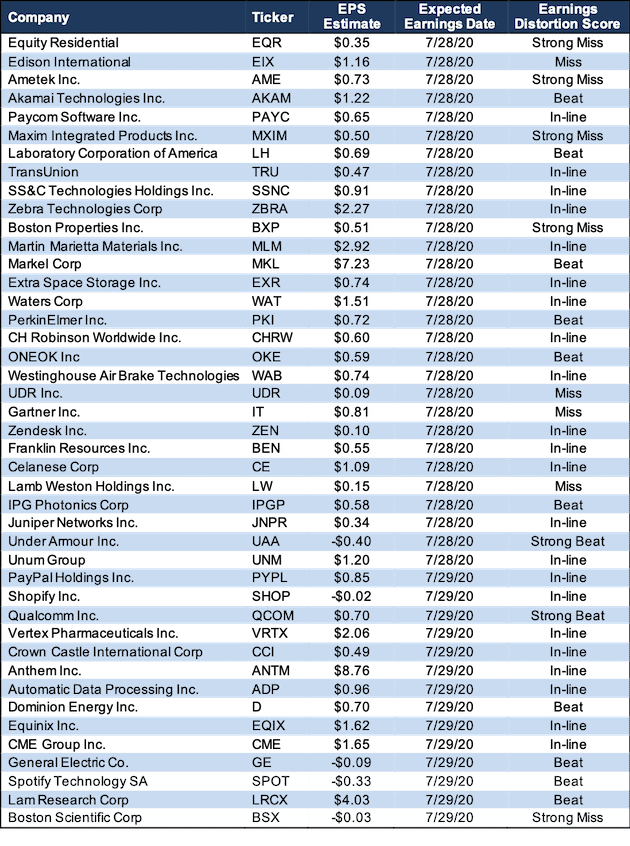
Appendix: All Major Companies Expected to Report July 27 – July 31
Figure 3 shows all the S&P 500 companies, plus those with market caps greater than $10 billion, that are expected to report the week of July 27, 2020.
Figure 3: Earnings Distortion Scorecard: Week of 7/27/20-7/31/20
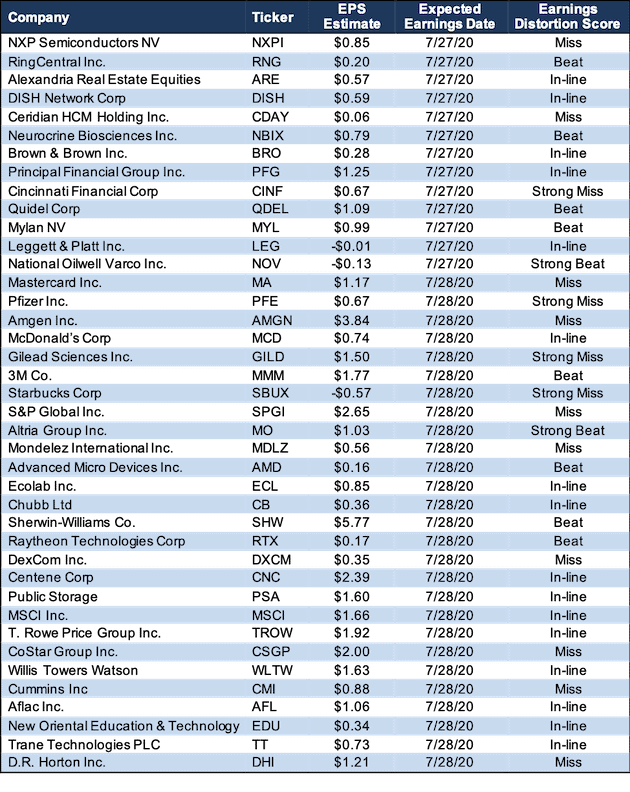
Sources: New Constructs, LLC and company filings
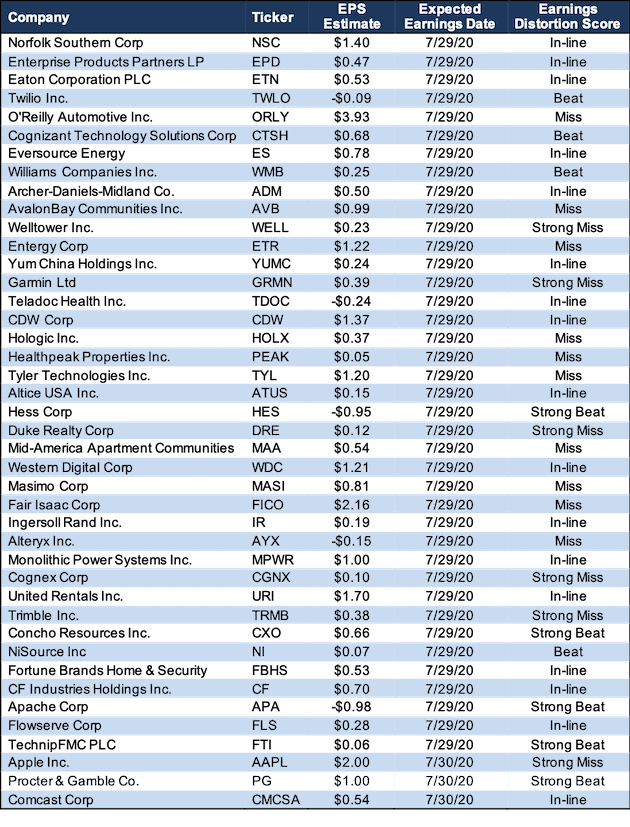
Figure 3: Earnings Distortion Scorecard: Week of 7/27/20-7/31/20 (continued)
Sources: New Constructs, LLC and company filings
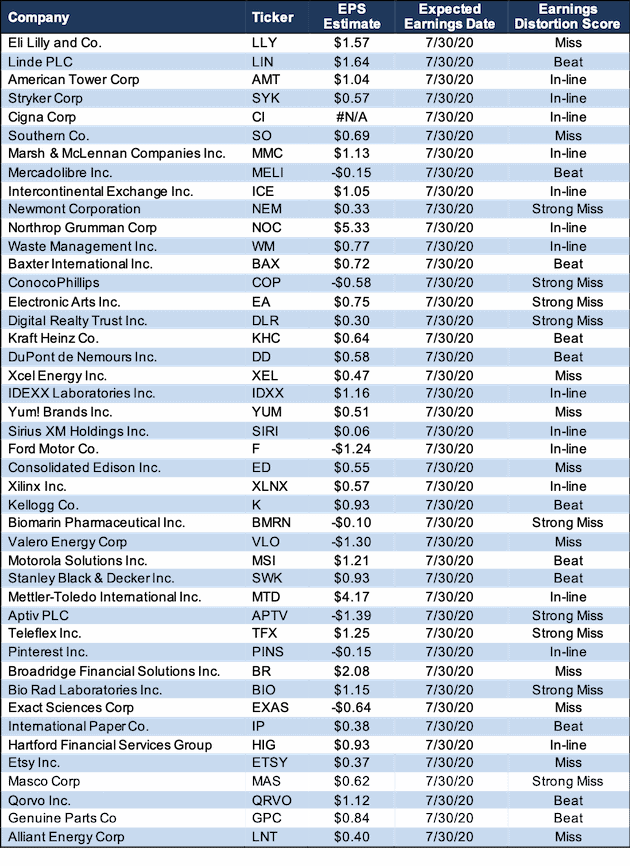
Figure 3: Earnings Distortion Scorecard: Week of 7/27/20-7/31/20 (continued)
Sources: New Constructs, LLC and company filings
Figure 3: Earnings Distortion Scorecard: Week of 7/27/20-7/31/20 (continued)
Sources: New Constructs, LLC and company filings
Figure 3: Earnings Distortion Scorecard: Week of 7/27/20-7/31/20 (continued)
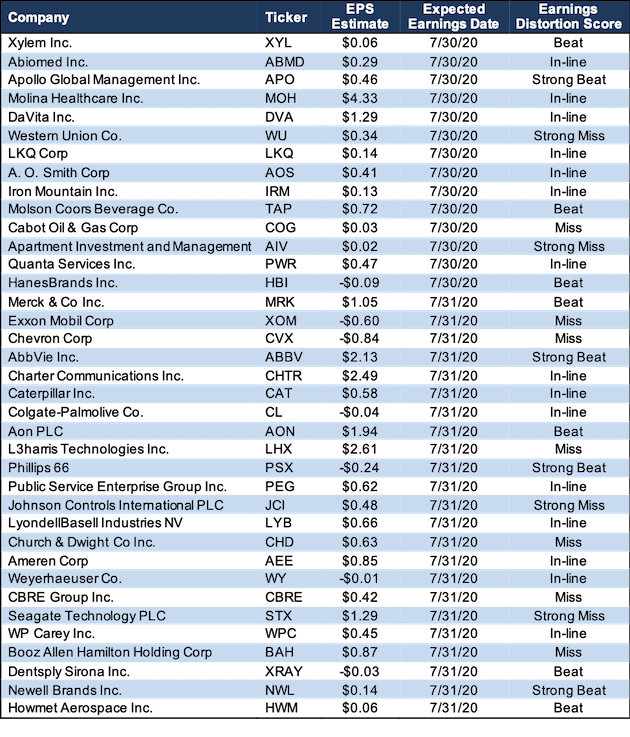
Sources: New Constructs, LLC and company filings
[1] Earnings Distortion scores on ~3,000 stocks are also available to clients of our website.