
The COVID-driven economic shutdown is hurting corporate earnings, but not as much as Wall Street analysts would have you think. Figure 1 shows that investors can ignore the warnings from Wall Street that the S&P is overvalued. Our calm, honest view of normalized earnings shows that the market still has some upside especially if we get good news on new treatments or a vaccine for the virus.
A More Rigorous Valuation of the S&P 500
Not only is the market cheaper than Wall Street would have you believe, profitability across the S&P 500 is much better. Core Earnings, which are adjusted for unusual gains/losses (hidden and reported) and missed by analysts, are much higher and less volatile than the consensus as calculated by S&P Global’s (SPGI) Operating Earnings[1].
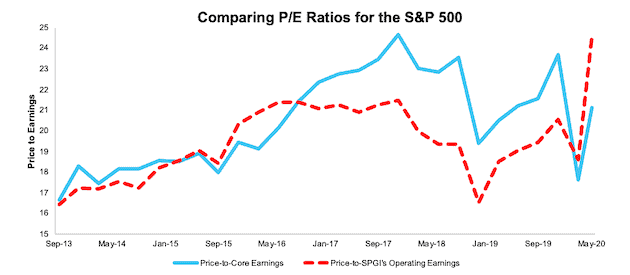
As shown in Figure 1, when we analyze the valuation of the S&P 500 using the price-to-earnings (P/E) ratio based on our normalized Core Earnings, we see how much investors oversold in March. We also see that the recent rebound puts the valuation of the S&P 500 at very reasonable levels compared to the past few years. In contrast, valuing the S&P based on SPGI’s Operating Earnings suggests the market is more highly valued than any time since the Financial Crisis (see Appendix II for more details).
We’re calling a market bottom in March. Looking ahead, we expect the market will be choppy as we see how the re-opening goes. The level of the S&P 500 at the end of 2020 depends on how well earnings rebound. In other words, there’s not a lot of money to be made in index investing unless you can predict how the re-opening of the economy will go. At the same time, we do not think the S&P 500 is overvalued or at risk of a big sell off.
Figure 1: Price-to-Core vs. Price-to-SPGI’s Operating Earnings: 2013 – present
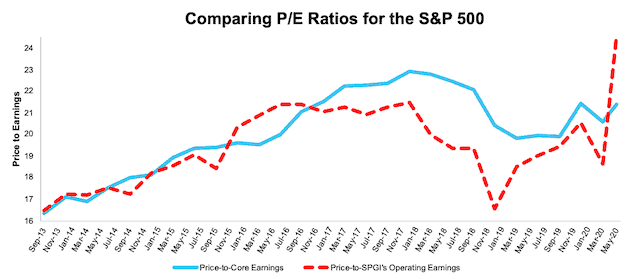
Sources: New Constructs, LLC, company filings, and S&P Global.
P/E ratios are based on four quarters of aggregated S&P 500 constituent results in each period. More details in Appendix I.
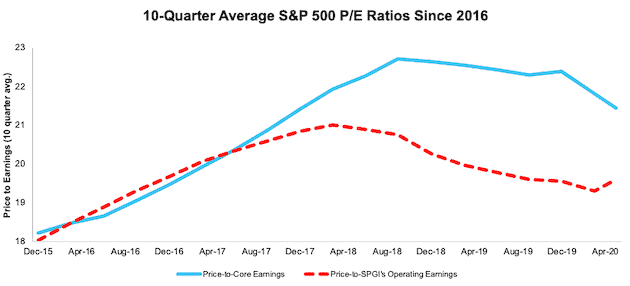
In Figure 2, we average the P/E ratios over the last ten quarters and see the Core Earnings P/E diverging more and more from the SPGI’s Operating Earnings P/E, which implied the index was more expensive than most investors realize. This divergence shows the market was due for a correction before COVID-19 and now trades at its lowest level in over two years. Both ratios are drifting lower over the last few years. The recent jump in the P/E on SPGI’s Operating Earnings is the misleading result of the misinformation in that measure.
Figure 2: Price-to-Core vs. Price-to-SPGI’s Operating Earnings: 10 Quarter Average
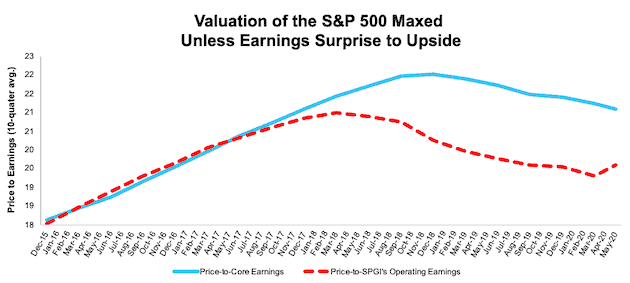
Sources: New Constructs, LLC, company filings, and S&P Global.
P/E ratios are based on four quarters of aggregated S&P 500 constituent results in each period. More details in Appendix I.
How You Can Make Money with Our Core Earnings
Passive investing has become a very crowded trade, and now is the best time in many, many years for investors to pick individual stocks, especially those armed with differentiated insight into earnings.
Table 1 lists the stocks that we find are among the most attractive in the market based on strong Core Earnings growth and valuations at historic discounts. Most of these picks have outperformed the S&P 500 significantly.
Table 1: Stock Picks in Today’s Market
| Company | Ticker | Publish Date | Performance vs S&P 500 |
| SYSCO Corporation | SYY | 4/15/20 | 9% |
| Simon Property Group | SPG | 4/20/20 | 30% |
| Darden Restaurants | DRI | 4/22/20 | 2% |
| D.R. Horton | DHI | 4/27/20 | 26% |
| Southwest Airlines* | LUV | 5/4/20 | 24% |
| Omnicom Group | OMC | 5/6/20 | -4% |
| Hyatt Hotels | H | 5/14/20 | 11% |
| Allstate Corp | ALL | 5/18/20 | -5% |
| JPMorgan Chase & Company | JPM | 5/21/20 | 8% |
| Caterpillar | CAT | 5/27/20 | 0% |
Sources: New Constructs, LLC
*At the end of this report, before the Appendices, we provide an excerpt from our LUV report so readers can get more details on our “see through the dip” thesis.
A New, Better Version of Earnings
As shown in Figure 1, a differentiated view on earnings can lead to a differentiated view on valuation. Our measure of Core Earnings leverages cutting-edge technology to provide clients with a cleaner and more comprehensive view of earnings, as shown in Figures 3 and 4[2].
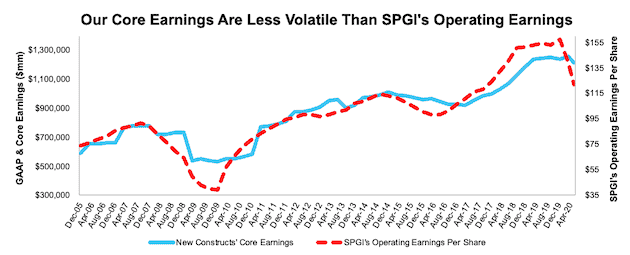
Trailing-twelve month (TTM) Core Earnings[3] for the S&P 500 have fallen 2% since the end of 2019 while consensus TTM Operating Earnings per share for the S&P 500 have fallen 22%. (We think SPGI’s Operating Earnings provide the best comparison to how we calculate Core Earnings.).
Figures 3 and 4 clearly illustrate that our Core Earnings is a better measure of the normalized performance of businesses.
Figure 3: Core Earnings vs. SPGI’s Operating Earnings for the S&P 500: 12/31/13 – 5/26/20
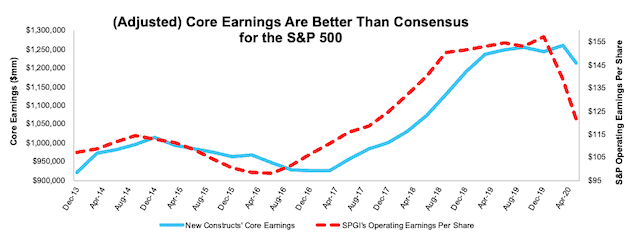
Sources: New Constructs, LLC, company filings, and S&P Global (SPGI).
Note: the most recent periods’ data for SPGI’s Operating Earnings is based on consensus.
Our Core Earnings analysis is based on aggregated quarterly data for the S&P 500 constituents in each measurement period.
Most investors know that GAAP earnings are prone to earnings distortion because they include unknown amounts of non-recurring or unusual items. However, as detailed in section 5.1 of Core Earnings: New Data & Evidence, professors from Harvard Business School & MIT Sloan show that “analysts are not efficient in incorporating the implications of non-core earnings in their forecasts”. The paper uses our Core Earnings research to prove the market is inefficient at reflecting unusual gains/losses buried in footnotes and to show the deficiencies of fundamental data from legacy providers.
Accordingly, investors armed with our measure of Core Earnings have a differentiated and more informed view of the fundamentals of companies.
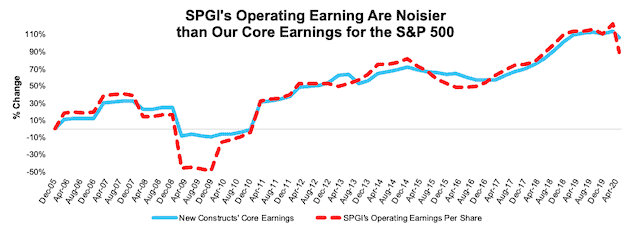
Figure 4: Core vs. SPGI’s Operating Earnings for the S&P 500 – % Change: TTM 12/31/13 – 5/26/20
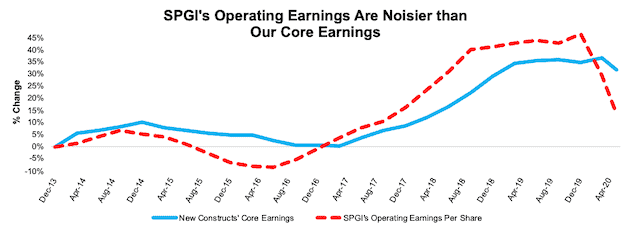
Sources: New Constructs, LLC, company filings, and S&P Global (SPGI).
Note: the most recent periods’ data for SPGI’s Operating Earnings is based on consensus.
Our Core Earnings analysis is based on aggregated quarterly data for the S&P 500 constituents in each measurement period.
Core Earnings Proven More Reliable in the Financial Crisis
Figure 5 shows just how different the P/E ratio of the S&P 500 was based on our Core Earnings compared to SPGI’s Operating Earnings during the years preceding and after the Great Recession.
Figure 5: Price-to-Core vs. Price-to-SPGI’s Operating Earnings: 2004-2012
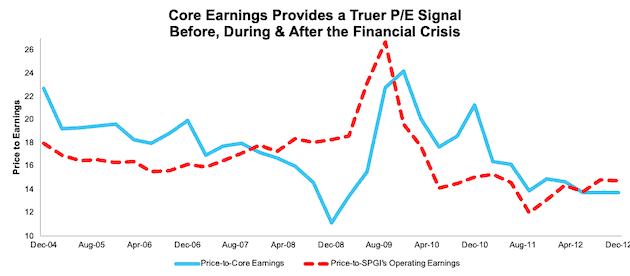
Sources: New Constructs, LLC, company filings, and S&P Global.
Note that the SPGI P/E is based on four quarters of aggregated S&P 500 results in each period. Core Earnings P/E is based on annual data.
Figure 1 shows how we use more accurate view of earnings to call a market bottom in March. Figure 6 points to the clear buying signal from the P/E based on our Core Earnings data. Figure 6 is the same as Figure 5 except that we add the price of the S&P 500 Index to illustrate how the P/E ratio using our Core Earnings provides a much better buy/sell signal than a P/E based on SPGI’s Operating Earnings.
Figure 6: Price-to-Core vs. Price-to-S&P Operating Earnings: 2004-2012
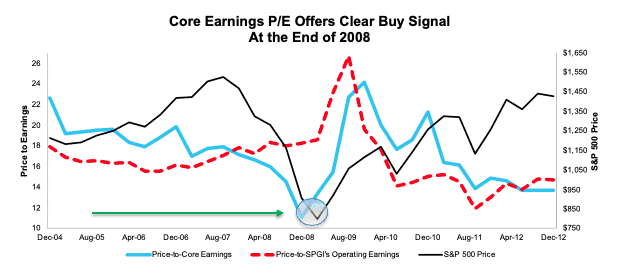
Sources: New Constructs, LLC, company filings, and S&P Global.
Note that the SPGI P/E is based on four quarters of aggregated S&P 500 results in each period. Core Earnings P/E is based on annual data.
Buffett Is Shortsighted on Airlines: LUV Is A Steal at This Price (excerpt from our May 4, 2020 report)
Warren Buffett recently made headlines at Berkshire Hathaway’s (BRK.A) annual shareholder meeting when he disclosed the firm sold its shares in the four largest U.S. airlines, citing that “the world changed for airlines”. While no one can argue with Buffett’s statement in the short term, i.e. 6-12 months, we disagree over the long term. Anything better than a worst-case scenario and LUV presents an excellent risk/reward at its current price.
In addition to the advantages outlined in our original report (largest domestic operator, superior record of profitability, smart investments in technology), LUV has a very strong balance sheet, ample liquidity, and is the only U.S. airline to receive an “investment-grade rating by all three rating agencies,” which increases its flexibility to raise additional capital should the need arise. There will be some carnage in the airline industry, but LUV is best-positioned not only to survive, but also to further widen its advantages over the competition.
After falling 49% YTD to $27.56/share (closing price as of May 4, 2020), and adjusting for the dilutive financing since the close of the first quarter noted above, LUV now trades at its cheapest PEBV ratio (0.6) in the history of our model. This ratio means the market expects LUV’s NOPAT to permanently decline by 40%. This expectation seems overly pessimistic over the long term.
LUV’s current economic book value, or no-growth value, after accounting for its dilutive financing activities, is $47/share – a 74% upside to the current price.
Figure 7: LUV’s Stock Price vs. Economic Book Value (EBV)
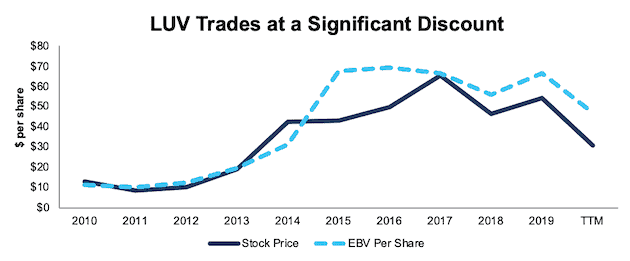
Sources: New Constructs, LLC and company filings.
LUV’s Current Price Implies No Economic Recovery
Below, we use our reverse DCF model to quantify the cash flow expectations baked into LUV’s current stock price. Then, we analyze the implied value of the stock based on different assumptions about COVID-19’s impact on the airline industry and LUV’s future growth in cash flows.
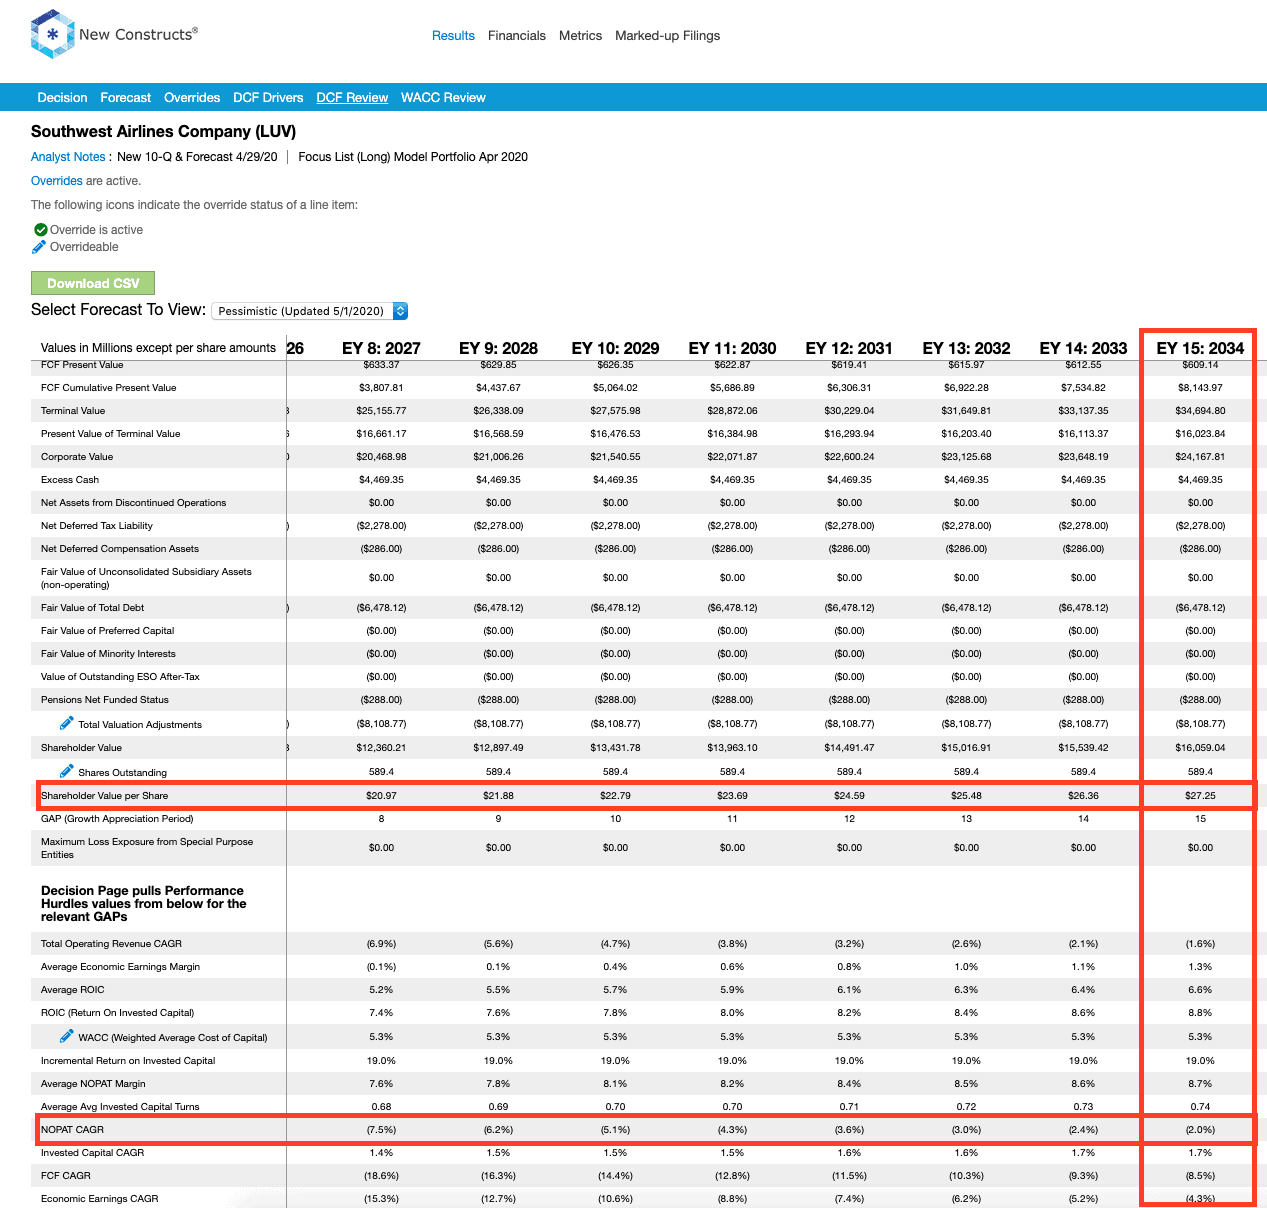
Scenario 1: Using recent projections for revenue declines, historical margins, and average historical GDP growth rates, we can model the worst-case scenario already implied by LUV’s current stock price. In this scenario, we assume:
- NOPAT margins fall to 3% (company average from 2002-2003) from 2020 to 2022 (vs. 11% 2019) and increase to 10% (below five-year company average of 12%) in 2023 and each year thereafter
- Revenue falls 55% (in line with recent global revenue decline projections) in 2020 and does not grow in 2021 or 2022
- Sales begin growing again in 2023, but only at 5% a year, which is below LUV’s revenue CAGR over the past two decades (8%)
In this scenario, where LUV’s NOPAT declines 47% compounded annually from 2019 to 2022 and 2% compounded annually over the next 15 years, the stock is worth $27.25 share today – or nearly equal to the current stock price. This scenario accounts for the dilutive share offering, debt issuance, and relief aid received from the CARES Act. We assume this capital will be used to cover LUV’s operating losses and do not treat it as excess cash. See the math behind this reverse DCF scenario.
For reference, LUV’s NOPAT declined by 53% compounded annually from 2000 to 2002 before growing by 14% compounded annually over the next decade (2003-2013).
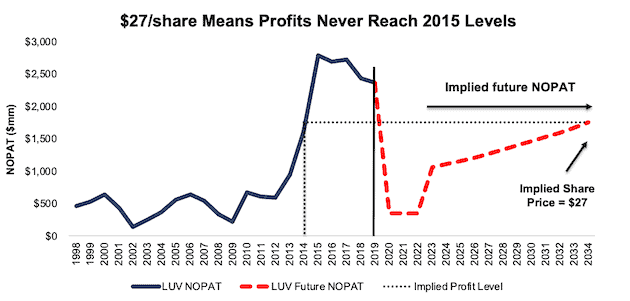
Figure 8 compares the stock’s implied future NOPAT to the firm’s historical NOPAT in this scenario. This worst-case scenario implies LUV’s NOPAT 15 years from now will be 26% below its 2019 NOPAT. In other words, this scenario implies that 15 years after the COVID-19 pandemic, LUV’s profits will have only recovered to ~2014 levels. In any scenario better than this one, LUV holds significant upside potential, as we’ll show below.
Figure 8: Current Valuation Implies Severe, Long-Term Decline in Profits: Scenario 1
Sources: New Constructs, LLC and company filings.
Scenario 2: Long-term View Could Be Very Profitable
If we assume, as does the IMF and nearly every economist in the world, that the global economy rebounds and returns to growth starting in 2021, LUV is highly undervalued.
In this scenario, we assume:
- NOPAT margins fall to 3% (company average from 2002 to 2003) from 2020 to 2022 (vs. 11% in 2019) and increase to 10% (below five-year company average of 12%) in 2023 and each year thereafter
- Revenue falls 55% (in line with recent global revenue decline projections) in 2020
- Revenue meets consensus expectations in 2021, 2022, and 2023 (+65%, +19%, and +12%) and 3.5% thereafter, which equals the average global GDP growth rate since 1961
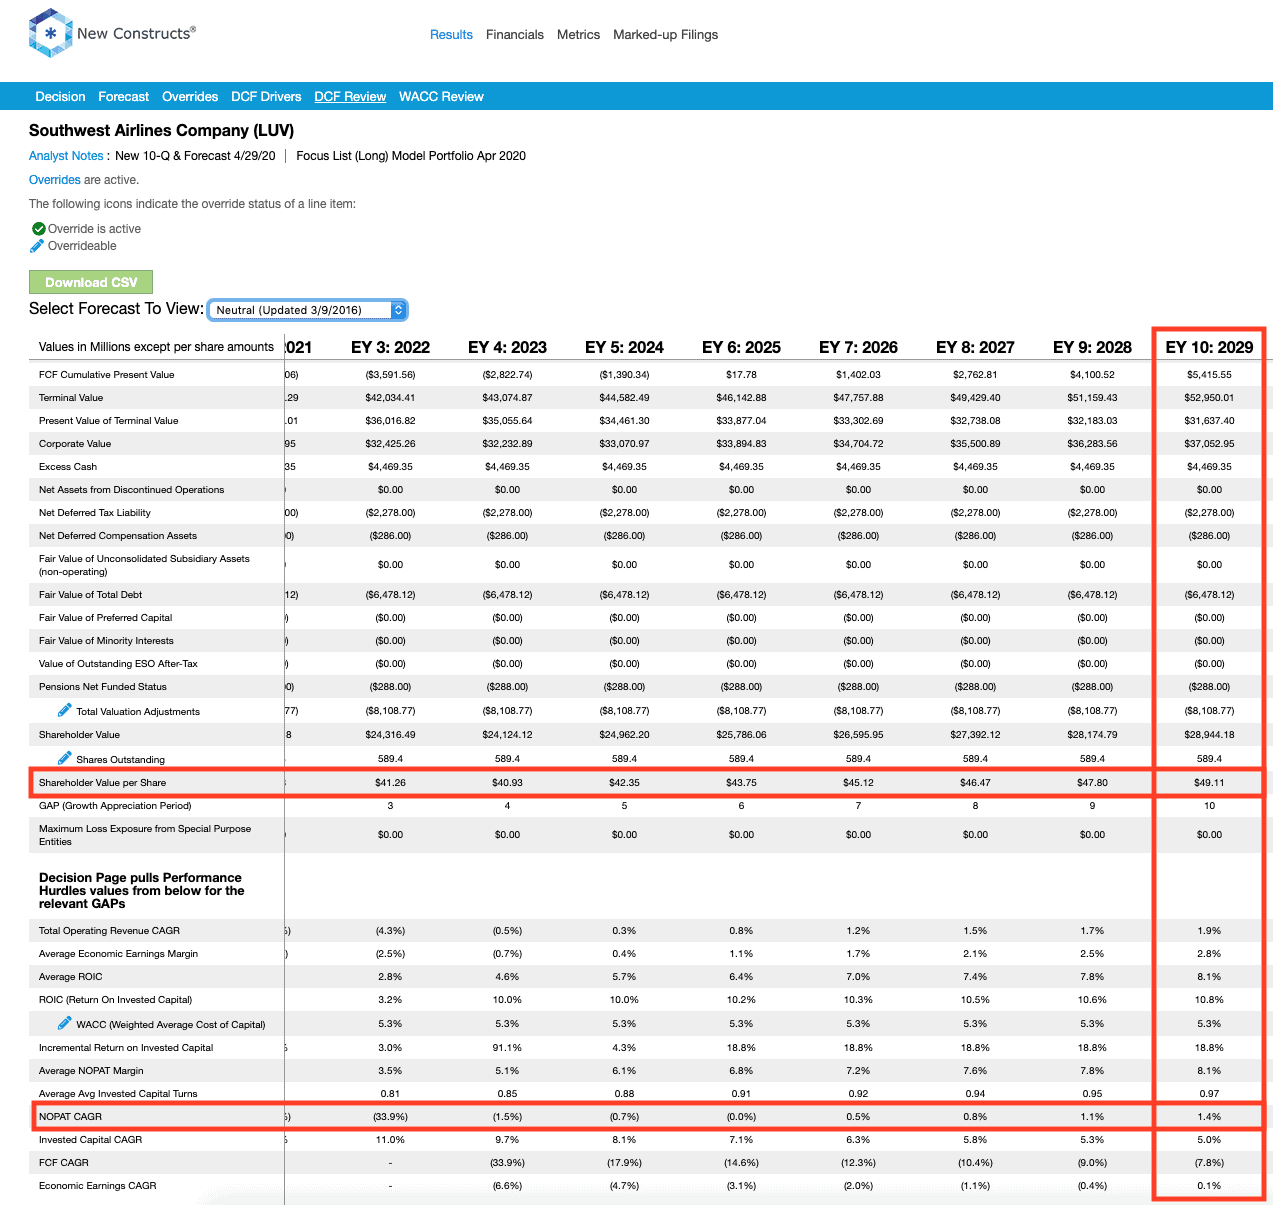
In this scenario, LUV’s NOPAT falls 85% in 2020 and grows by 1% compounded annually over the next decade, and the stock is worth $49/share today – a 78% upside to the current price. This scenario also accounts for the dilutive share offering, debt issuance, and relief aid received from the CARES Act. We assume this capital will be used cover LUV’s operating losses and do not treat it as excess cash on the balance sheet. See the math behind this reverse DCF scenario.
For comparison, LUV has grown NOPAT by 8% compounded annually over the past five years and 26% compounded annually over the past decade.
It’s not often investors get the opportunity to buy an industry leader at such a discounted price.
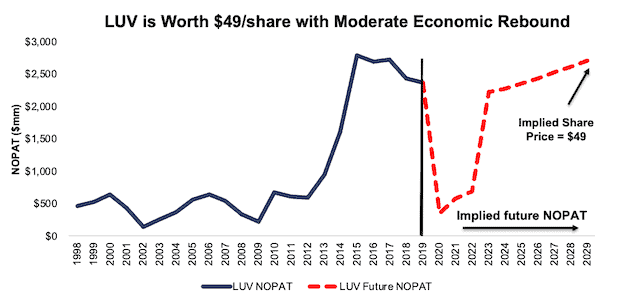
Figure 9 compares the stock’s implied future NOPAT to the firm’s historical NOPAT in scenario 2.
Figure 9: Implied Profits Assuming Global Recovery Starts in 2021: Scenario 2
Sources: New Constructs, LLC and company filings.
Core Earnings Show LUV Is Still Cheap Relative to the S&P 500
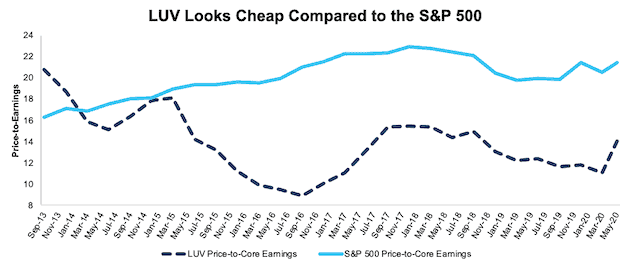
Despite rising 33% since our article was published, Southwest Airlines’ stock remains cheap when we analyze it’s price-to-Core Earnings. Per Figure 10, LUV was most undervalued relative to the S&P 500 in late 2016, and, despite the bounce since mid-May, remains much cheaper than the index.
Figure 10 shows how investors can use our Core Earnings research to pick individual stocks with greater confidence. Better research can be a source of significant competitive advantage as well as protection against the unexpected.
Figure 10: Price-to-Core Earnings: LUV vs. S&P 500
Sources: New Constructs, LLC, company filings, and S&P Global.
Note that the Core Earnings P/E ratio is based on four quarters of aggregated results for constituents in each period. More details in Appendix I.
This article originally published on June 12, 2020.
Disclosure: David Trainer owns SYY, SPG, DHI, LUV, JPM, and H. David Trainer, Kyle Guske II, and Matt Shuler receive no compensation to write about any specific stock, style, or theme.
Follow us on Twitter, Facebook, LinkedIn, and StockTwits for real-time alerts on all our research.
Appendix I: P/E Ratio Methodology for Core & SPGI’s Operating Earnings
In the analysis above, we calculate the price-to-Core Earnings ratio as follows:
- Calculate a trailing four quarters earnings yield for every S&P 500 constituent
- Weight the earnings yield by each stock’s respective S&P 500 weight
- Sum the weighted earnings yields and take the inverse (1/Earnings Yield)
This method allows us to capture the impact of changes to S&P 500 constituents on a quarterly basis. For example, a company could be a constituent in 2Q18, but not in 3Q18. This method captures the continuously changing nature of the S&P 500 constituency.
We use the earnings yield methodology because P/E ratios don’t follow a linear trend. A P/E ratio of 1 is “better” than a P/E ratio of 30, but a P/E ratio of 30 is “better” than a P/E ratio of -15. In other words, aggregating P/E ratios can result in a low multiple due the inclusion of just a few stocks with negative P/Es.
Using earnings yields solves this problem because a high earnings yield is always “better” than a low earnings yield. There is no conceptual difference when flipping from positive to negative earnings yields as there is with traditional P/E ratios.
For all periods in the above analysis, we calculate the price-to-SPGI’s Operating Earnings ratio by summing the preceding 4 quarters of Operating Earnings per share and, then, dividing by the S&P 500 price at the end of each measurement period.
Figures I and II show the price-to-Core Earnings ratio using TTM data for the companies in the S&P 500. Price-to-SPGI’s operating earnings are always calculated in the manner defined above because we do not have access to TTM Operating Earnings data for S&P 500 constituents. In these Figures, we calculate the price-to-Core Earnings ratio as follows:
- Calculate a TTM earnings yield for every S&P 500 constituent
- Weight the earnings yields by each stock’s respective S&P 500 weight
- Sum the weighted earnings yields and take the inverse (1/Earnings Yield)
Figure I: Price-to-Core vs. Price-to-SPGI’s Operating Earnings: TTM 9/30/13 – present
Sources: New Constructs, LLC, company filings, and S&P Global.
Note that the Core Earnings P/E ratio is aggregating the TTM results for constituents in each period.
Figure II: Price-to-Core vs. Price-to-SPGI’s Operating Earnings: TTM 10 Quarter Average
Sources: New Constructs, LLC, company filings, and S&P Global.
Note that the Core Earnings P/E ratio is aggregating the TTM results for constituents in each period.
Appendix II: Additional Historical Analysis
Figure III shows Core Earnings and S&P Operating Earnings per share dating back to 2005.
Note: In Figures III and IV, for analysis post 9/30/13, we use aggregated quarterly data for the companies in the S&P 500. For values prior to 9/30/13, we use aggregated annual data for every company in the S&P 500. While we prefer aggregated quarterly numbers, we have examined the potential impacts of the two methodologies and have found no material differences.
Figure III: Core vs. SPGI’s Operating Earnings for the S&P 500: 12/30/05 – 5/26/20
Sources: New Constructs, LLC, company filings, and S&P Global (SPGI).
Note: the most recent periods’ data for SPGI’s Operating Earnings is based on consensus.
Figure IV shows the percentage change in our Core Earnings vs. the percentage change in SPGI’s Operating Earnings per share since 12/31/05.
Figure IV: Core vs. SPGI’s Operating Earnings for the S&P 500 – % Change: 12/30/05 – 5/26/20
Sources: New Constructs, LLC, company filings, and S&P Global (SPGI).
Note: the most recent periods’ data for SPGI’s Operating Earnings is based on consensus.
Figure V shows the price-to-Core Earnings and price-to-SPGI’s Operating Earnings ratio dating back to 2004.
Figure V: Price-to-Core vs. Price-to-SPGI’s Operating Earnings: Since 2004
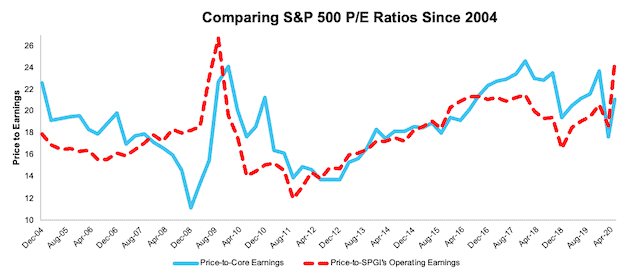
Sources: New Constructs, LLC, company filings, and S&P Global.
Note that the SPGI P/E is based on four quarters of aggregated S&P 500 results in each period. Core Earnings P/E is based on annual data.
[1] The methodology for calculating an apples-to-apples price-to-Core Earnings and price-to-SPGI’s Operating Earnings is in Appendix I. Contact us at support@newconstructs.com to access to the source data behind this research.
[2] For 3rd-party reviews on the benefits of adjusted Core Earnings, historically and prospectively, across all stocks, click here and here.
[3] Our Core Earnings data is based on all 10-Q and 10-K filings for S&P 500 constituents as of 5/26/2020. Since then, an immaterial number of companies (18) companies have filed a new 10-K or 10-Q with the SEC.