
Our goal at New Constructs is to level the playing field for all investors. We seek the truth, in company filings, footnotes, and MD&A, and we deliver it to our clients at scale.
Through these efforts, we’ve gathered unrivaled experience in endowing machines with the subject matter expertise to perform like human experts. The result?
An AI Agent for investing that generates insights and signals that produce novel alpha. Core Earnings, which is a much cleaner and more accurate earnings metric, is one such signal.
This paper from the Harvard Business School and MIT Sloan professors empirically proves the idiosyncratic alpha in our proprietary measure of Core Earnings.
The Bloomberg New Constructs 500 Total Return Index (B500NCT:IND) offers real-time proof of the alpha that Core Earnings generates. The index beat the S&P 500 by over 32% over the last five years, rising 126% while the S&P 500 was up 94%. Provided by Bloomberg, this index takes the top 500 stocks by market cap and weights stocks based on Earnings Capture[1] instead of weighting each stock by market cap.
So, the companies whose Core Earnings exceed GAAP earnings by the most get the largest weightings. We like to call this index the “Enhanced S&P 500 Index.”
The companies with the highest profits deserve larger allocations, and the results of this strategy speak for themselves.
Below, we share one of the stocks in the Bloomberg New Constructs 500 Index along with a brief overview of why it deserves a larger weighting (by Core Earnings) than it earns through market cap alone.
Enjoy this free stock pick. Feel free to share it with friends and family. We are proud of our work and want more people to see it.
Featured Stock from Bloomberg New Constructs 500 Total Return Index: Eli Lilly & Company (LLY)
Eli Lilly (LLY: $845/share) is currently 1.2% of the S&P 500, but it is 2.2% of the Bloomberg New Constructs 500 Total Return Index. Why the discrepancy? Core Earnings power.
Eli Lilly has the 24th highest Earnings Capture (4.3%) among the S&P 500 companies. A higher Earnings Capture means a larger weighting in this index.
The company has the 15th highest trailing-twelve months (TTM) Core Earnings of all S&P 500 companies.
Importantly, Eli Lilly has grown Core Earnings faster than reported earnings (GAAP Net Income) in recent years. Per Figure 1, Eli Lilly’s Core Earnings grew from $4.8 billion in 2019 to $18.1 billion in the TTM, or 20% compounded annually. The company’s GAAP Net Income increased from $8.3 billion to $13.8 billion over the same time, or 18% compounded annually.
2020 provides a clear inflection point in Earnings Distortion, as shown in Figure 2. In 2020, Eli Lilly’s Earnings Distortion totaled $441 million, which means GAAP net income overstated Core Earnings by $441 million.
In the TTM ended 2Q25, Eli Lilly’s Earnings Distortion is -$4.3 billion, which means GAAP net income understates Core Earnings by that amount. In other words, Eli Lilly is more profitable than investors relying on GAAP net income realize.
Figure 1: Eli Lilly’s Core Earnings vs. GAAP Net Income Since 2019
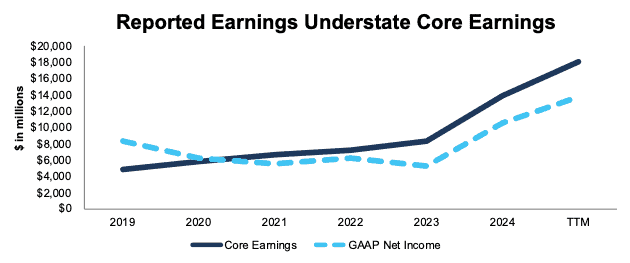
Sources: New Constructs, LLC and company filings
Not only does Eli Lilly generate the top-tier Core Earnings, the company has consistently grown its revenue, net operating profit after tax (NOPAT), and return on invested capital (ROIC).
Eli Lilly has grown revenue and NOPAT by 10% and 21% compounded annually over the last decade, respectively. Eli Lilly’s NOPAT margin increased from 13% in 2014 to 35% in the TTM while its invested capital turns rose from 0.7 to 0.8 over the same time. Rising NOPAT margins and invested capital turns drive Eli Lilly’s ROIC from 9% in 2014 to 26% in the TTM.
Figure 2: Eli Lilly’s Revenue and NOPAT Since 2014
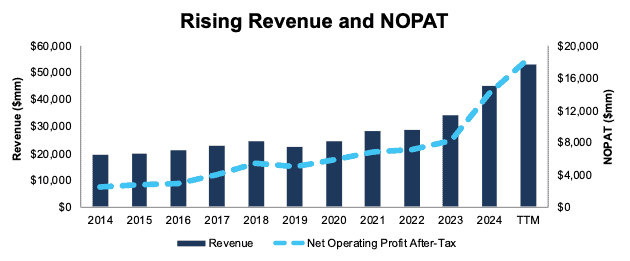
Sources: New Constructs, LLC and company filings
Real-Time Proof of the Alpha in our Superior Earnings Metric
As noted above, you don’t have to take our word that Core Earnings, and allocating to stocks based on Core Earnings, drives novel alpha. The outperformance of the Bloomberg New Constructs 500 Index demonstrates real-time alpha.
Per Figure 3, the Bloomberg New Constructs 500 Total Return Index (ticker: B500NCT:IND) beat the S&P 500 by over 32% over the last five years, rising 126% while the S&P 500 was up 94%.
Figure 3: Bloomberg New Constructs 500 Index Strongly Outperforms the S&P 500 Over the Last 5 Years
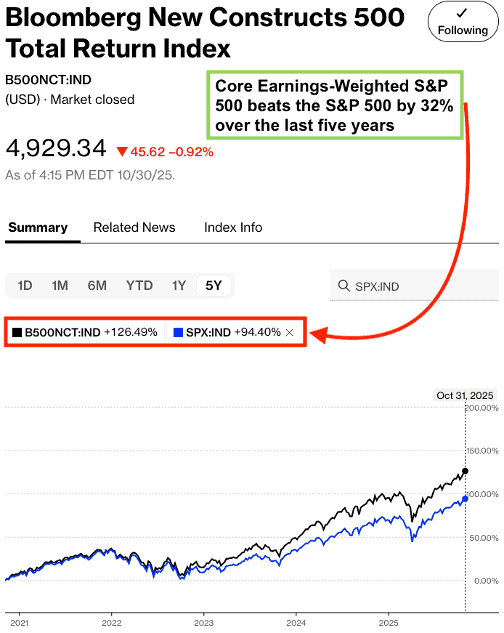
Sources: Bloomberg as of October 31, 2025
Note: Past performance is no guarantee of future results.
Wondering how the index has done more recently? See Figure 4 for details on the outperformance of the Bloomberg New Constructs 500 Total Return Index in the first half of 2025. B500NCT:IND was up 18% while the S&P 500 was up 16%.
Figure 4: Bloomberg New Constructs 500 Index Strongly Outperforms the S&P 500 YTD

Sources: Bloomberg as of October 30, 2025
Note: Past performance is no guarantee of future results.
This article was originally published on October 31, 2025.
Disclosure: David Trainer, Kyle Guske II, and Hakan Salt receive no compensation to write about any specific stock, style, or theme.
Questions on this report or others? Join our online community and connect with us directly.
[1] Earnings Capture equals Core Earnings minus GAAP earnings, divided by the company’s total assets. Note that Earnings Distortion equals GAAP Earnings or Street Earning minus Core Earnings, so high Earnings Distortion is bad.