Forget all the “earnings season” analysis you read last month. The real earnings season—annual 10-K filing season—is happening right now.
Every year in this six-week stretch from mid-February through the end of March, we parse and analyze roughly 2,000 10-Ks to update our models for companies with a 12/31 fiscal year end. Our analysts work tirelessly to uncover red flags hidden in the footnotes and make our models the best in the business.
There’s no way we could analyze so many filings in such a short time without our engineering team’s help. Using machine learning and natural language processing, we automate much of the rote work of data gathering and modeling. Our technology frees our analysts up to spend more time on the complicated and unusual data points that other firms miss.
Investors understand that analyzing all financial statements and footnotes is an essential part of the diligence needed to fulfill the fiduciary duty of care. How else can one make the necessary adjustments to assess a company’s true earnings and return on invested capital (ROIC)? Our innovation is to scale this diligence and make it easily accessible to our subscribers.
What We Accomplished Yesterday
Figure 1 shows the work our analysts did yesterday and over the entirety of this filing season so far.
Figure 1: Filing Season Diligence
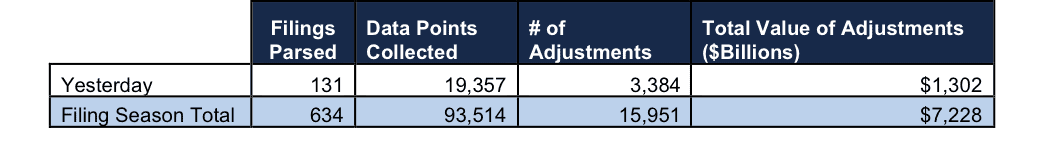
Sources: New Constructs, LLC and company filings.
Yesterday, our analysts parsed 131 filings and collected 19,357 data points. In total, they made 3,384 adjustments with a dollar value of $1.3 trillion. That breaks down into:
- 1,382 income statement adjustments with a total value of $89 billion
- 1,462 balance sheet adjustments with a total value of $528 billion
- 540 valuation adjustments with a total value of $685 billion
In particular, analyst Peter Apockotos found an unusual item yesterday in Chart Industries (GTLS: $36/share) 10-K.
On page 42 of the financial footnotes (page 95 overall), we found over $15 million in hidden non-operating income due to the recovery of warranty costs related to product lines acquired in 2012. This non-operating item represents 55% of Chart Industries’ reported GAAP net income for 2016. Removing the impact of this unusual item, along with other adjustments, reveals that Chart Industries operating profit (NOPAT) declined by 39% in 2016, as opposed to the significant increase in its reported net income.
This article originally published here on March 1, 2017.
Disclosure: David Trainer, Peter Apockotos, and Sam McBride receive no compensation to write about any specific stock, sector, style, or theme.
Follow us on Twitter, Facebook, LinkedIn, and StockTwits for real-time alerts on all our research.
Scottrade clients get a Free Gold Membership ($588/yr value) as well as 50% discounts and up to 20 free trades ($140 value) for signing up to Platinum, Pro or Unlimited memberships. Login or open your Scottrade account & find us under Quotes & Research/Investor Tools.