
See the free webinar on ROIC by our CEO.
The Purpose of the Stock Market
The purpose of the stock market is to allocate capital to its most efficient use. Research on economies around the world shows that functioning capital markets are positively correlated with economic growth. The more liquid and efficient the stock market is, the more the entire economy thrives.
Since capital markets exist to maximize allocative efficiency, we would expect the agents of capital—corporate executives—to focus on that goal. Yet, we know they do not. There are simply too many disincentives, such as huge bonuses tied to performance metrics that do not resemble shareholder value creation, including
- GAAP earnings
- Reported cash flow
- EBITDA and EV/EBITDA
- Return on equity
- Accounting book value
- Various other “non-GAAP” metrics
Not only do these metrics do a poor job of representing efficient capital allocation and value creation, they are also easily manipulated. A recent survey of CFO’s featured on MarketWatch showed 20% of companies misrepresent earnings by 10% or more, and, importantly, that Wall Street analysts do nothing about it.
It’s incredible that corporate executives and the market as a whole continue to depend on such flawed numbers when we already have a measure that is clearly linked with value creation: return on invested capital (ROIC). Figure 1 shows that ROIC has a clear and strong link to valuation for S&P 500 stocks.
Figure 1: ROIC Has The Largest Impact On Valuation
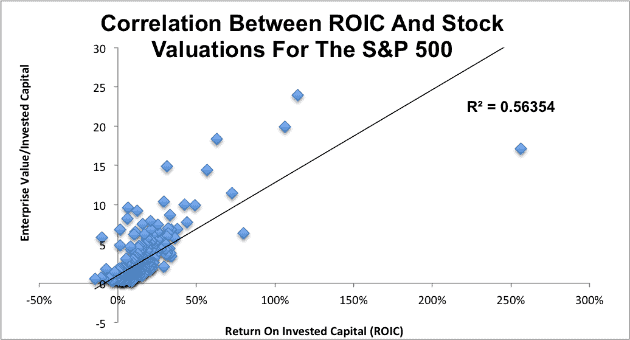
Sources: New Constructs, LLC and company filings.
This strength of this relationship is intuitive. If the purpose of capital markets is to promote the most efficient use of capital, it makes sense that the market would reward companies that earn the most profit per dollar of capital invested with the highest valuations.
Why Aren’t People Using ROIC?
The merits of linking stock valuation to shareholder value creation are so obvious that many believe it’s already what “analysts” and “smart investors” do. When I got to Wall Street, I was shocked at how much resistance there was to using value-based metrics like ROIC and Economic Value Added (EVA). After I left Wall Street to start New Constructs, the first reaction from investors that I called on was “why would anyone need research from New Constructs when that’s what the Wall Street already analysts do?”
The truth is, Wall Street has a lot of incentives not to deliver shareholder-value based research at scale. Most importantly, that business model wouldn’t pay as well as the status quo, which is pretty great for the big investment banks[1]. They are able to sell simplistic and conflicted research because, even though the market as a whole values ROIC, the majority of investors don’t take the time to dig this deep.
In 2005, Brian Bushee at the Wharton School of Business looked at the behaviors of institutional investors. Here’s what he found.
- 61% are “Quasi-Indexers” that hold a large number of small stakes with low turnover, meaning they have little impact on market valuations.
- 31% are “Transients” that hold a large number of small stakes with high turnover, meaning they’re high volume of trading can have a big impact in the short-term, but doesn’t produce long-term gains because they’re going to sell any stake they take within a short time frame.
- 8% are “Dedicated”. These are the investors that do a significant amount of research before taking large stakes and holding them for a long time. Ultimately, it’s this small portion of investors that have the largest impact on long-term valuations.
Given the success and growth of the online brokers over the last decade, we think Bushee’s analysis, if applied to the entire investor population, would show even fewer “Dedicated” investors and far more Transients today. Nevertheless, looking at his numbers, it becomes clear how simplistic research proliferates.
Wall Street, the financial media and other purveyors of stock research want to serve the largest market, and that’s the quasi-indexers and transients who aren’t taking the time to do the deep research that an ROIC-based model requires.
Transients[2] pile into companies that beat on quarterly earnings or meet certain technical indicators, giving the appearance that these measures drive stock prices even though these movements tend to be short-lived and have no basis in the underlying cash flows of the company. Since the transients turn around and sell their stakes quickly, the positive impact they have on the stock is soon cancelled out.
If technical research and superficial research works for 92% of investors, why provide anything else? Why do the hard work of really measuring value creation?
And it is hard work. Real shareholder value-based research is very difficult and time consuming, much more so than many people realize. Measuring shareholder value requires deep fundamental research that (1) translates reported accounting results into true cash flows and (2) quantifies the expectations for future cash flows that is embedded in stock valuations.
The first task requires deep expertise in both accounting and finance along with the fortitude to read 200+ page annual reports for every year of history you want to analyze. The second task requires additional expertise in valuation and the construction of large and complex models. Now, take into account that you have to do this work every single company you want to analyze or compare.
We are talking an almost impossible task. That is not to say that large firms have not tried. In the 1994 article from CFO Magazine, “Metric Wars”, several firms are featured for their unique consulting practices built around their proprietary measures of shareholder value creation. They failed for a variety of reason detailed here, but not because they had a bad idea. They had a great idea. They just lacked the technology to make that idea work.
As a result, investors have settled on simplistic metrics for evaluating executives or given up on trying to measure the process of corporate value creation by focusing solely on metrics such as Total Shareholder Return (TSR), GAAP earnings, non-GAAP earnings, top line revenue growth, or even just subscriber growth. As a result, we have a “tail wagging the dog” situation where investors link moves in the stock to how companies perform versus these simplistic metrics, and they totally ignore the true economics of the business. The more investors see stocks react in this way, the more they think the simplistic metrics drive the market, and the cycle spirals downward.
ROIC Is Hard
Calculating ROIC is hard. The formula for it seems simple, it’s just:

Unfortunately, accounting rules were originally designed for debt investors, not equity investors. Investors that want to calculate ROIC accurately have to make dozens of adjustments for each company. Financial statements are littered with one time items and non-operating income that have to be removed from reported earnings in order to get Net Operating Profit After Tax (NOPAT). Hidden off-balance sheet assets and write-downs have to be added back in order to calculate Invested Capital.
Most investors simply don’t have the time and the expertise to dig through ridiculously and increasingly long filings (152 pages on average) and make these adjustments. For that reason, they’ve continued to rely on inferior metrics while only the most sophisticated professional investors have been able to dig through the accounting data and uncover the true underlying economics of a company.
This pattern has only been reinforced by the large number of sell-side analysts who continually forecast EPS and publish seemingly arbitrary price targets based off of those forecasts. These analysts have no incentive to look deeper than topline earnings. Their job is to maintain good relationships with companies their institution wants to do business with, and to promote their institution through their “research”. Back in 2000, the CEO of Bear Stearns actually referred to its chief economist as an “entertainer”. Most sell-side analysts will admit they do not get paid for much beyond setting up meetings with company management teams for their clients.
My point is that the challenge is not in the idea. It is in the implementation of the idea. Everyone wants to invest like Warren Buffet, but few want to do the work required to match his analytical advantage (assuming that is even possible). In many ways, the smarter you are, the harder it is to make yourself analyze the tortuously long annual reports. There are, especially over the last 20 years, too many other ways (e.g. expert networks, algo trading, high-frequency trading, momentum trading, follow Cramer on CNBC etc) to make money with less effort.
What’s Changed?
The key to implementing shareholder value-based research at scale is to match the analytical skills of human beings with the data processing capabilities of machines. Analyzing an annual report and building a model is not something a machine can do on its own. Anyone who has ever done so can validate this assertion. Companies disclose information in so many different ways, and the nuances of accounting and legal language in the filings are too subtle for machines to decipher without human aid.
On the other hand, reading these exceptionally long reports and manually entering in the data for a large number of companies is too time-intensive. You’d need thousands of exceptionally smart and skilled humans to engage in a very laborious, mundane, monotonous activity for very long periods of time. How do you do that?
We succeeded where others failed by leveraging technology to bring enough automation to the process of analyzing filings and building models to keep smart analysts around long enough to justify training them. And we store everything they do in a database of human-validated parsing instructions, which we used to make the parsing machines smarter so they can do more and humans do less. The fact of the matter is that machines are better than humans at parsing. Machines do not experience the mental atrophy that humans do when performing repetitive and mundane tasks like analyzing 500+ page annual reports.
For example, if our team parsed a certain string of text into the same bucket every one of the 70,000 times we saw that string of text, then we no longer need a human to parse that value. Based on an exact match with prior, human-validated work, we can fully trust the machine to parse those items correctly.
By combining the efforts of smart analysts with machines that can automate most of the simplistic tasks, we are able to deliver corporate performance and valuation metrics for 95% of the world’s market cap that are:
- Accurate
- Comparable
- 100% Transparent
- Easily Accessible
As Figure 2 shows, our models and methodologies are firmly rooted in the work done by the great value investors who have come before us. What’s changed is that our technology allows us to apply that rigor to a larger number of companies and to make that research transparent and accessible en masse.
Figure 2: High Quality Research On A Large Number Of Stocks
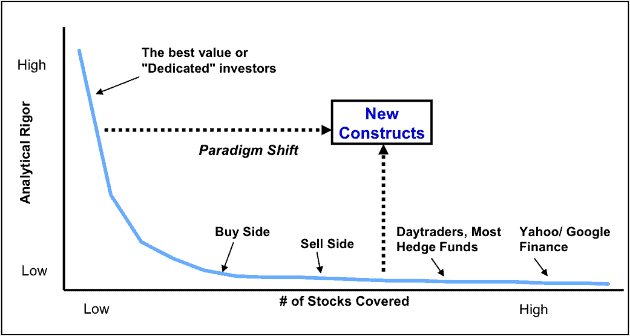
Sources: New Constructs, LLC and company filings.
We see this research as being beneficial not just for investors, but for the entire economy. The current corporate focus on performance metrics unrelated to the economics of businesses leads to value destroying decisions, as detailed in the Harvard Business Review article, “The Overvaluation Trap”. Executives that have to try to justify inflated valuations, pursue flashy acquisitions or use accounting gimmicks to boost EPS, even as these decisions lower ROIC and destroy shareholder value in the long term[3].
As more investors are able to perform and access sophisticated, shareholder-value based research, capital markets will, on the margin, be more efficient. Rather than aiming for EPS growth, executives will be judged on their ability to allocate capital efficiently. More efficient capital allocation makes for a more productive economy and more value created for investors.
Proof That Focusing on ROIC Pays Off
For those that may not yet be convinced, let’s take a look at some examples where focusing on ROIC helped companies deliver outsized value to their shareholders.
- The only seven surviving companies whose stock prices rose more than 10% in 2008 all earned consistently high ROICs. Not only did those stocks thrive during the market crash, they have continued to outperform during the current bull market.
- Fortune’s 2015 ranking of corporate executives, based in part on shareholder return, was almost exclusively comprised of executives at companies that earned double digit ROICs.
- Big acquisitions, which tend to improve earnings at the expense of ROIC, have a long history of destroying value for investors.
One of our favorite examples, though, is the company AutoZone (AZO). We’ve been fans of AutoZone for quite a while, and for one simple reason: the auto parts retailer is one of the few companies out there that puts a big premium on optimizing ROIC.
This emphasis shows up at every level. The company shows its ROIC calculations in its quarterly and annual filings. Its executives discuss ROIC on almost every single conference call, which is no surprise since a significant portion of their bonuses are tied to improving ROIC.
How has this worked out for investors? Over the past 15 years, AZO has doubled its ROIC from 12% in 2000 to 24% in 2015. In that timeframe, the stock has gone up an incredible 2,472%, versus less than 50% for the S&P 500.
A New Paradigm For Investors And Executives
AutoZone is just one example, but the broader data supports the underlying point. Focusing on ROIC helps companies maximize long-term value for their shareholders. And, in the medium and long term, maximizing ROIC is what is best for everyone.
Technological advancement is having a radical effect on the stock market, helping to make it more transparent, democratic, and efficient. Information asymmetry becomes less pronounced every day. It used to be that Wall Street insiders could access key financial data before everyone else. Now, anyone with an internet connection can access a mountain of financial data in real time.
There remains a disparity in the level of analysis that individual investors are able to perform, but New Constructs and other companies in the industry are working hard to remove these barriers and allow everyone to cut through the noise of EPS and non-GAAP earnings to understand the real economic realities of the companies they’re investing in.
As this transparency increases, executives are going to have to adapt. Short-term fixes like acquisitions and buybacks won’t cut it anymore, and they’ll have to focus more on creating long-term value for shareholders by allocating capital more efficiently.
Ultimately, this increased transparency and efficiency will be good for investors, companies, and the economy as a whole.
[1] For example, JP Morgan’s (JPM) 4Q15 revenue was $23.7 billion. Its top 5 executives earned over $85 million in 2014.
[2] Due to their high trading volume, Transients are the most profitable investor type for Wall Street. It’s no wonder that so much research and media is geared toward encouraging frequent trading.
[3] Part of understanding ROIC is to understand the Weighted Average Cost of Capital (WACC). Put simply (more details here), if a company earns an ROIC above WACC, then it has positive Economic Earnings. If its ROIC is below WACC, then Economic Earnings are negative.
Disclosure: David Trainer and Sam McBride receive no compensation to write about any specific stock, sector, style, or theme.
6 replies to "ROIC: The Paradigm For Linking Corporate Performance To Valuation"
Please send me information on getting your service including cost and how to access
Thanks for your interest!
You can find our service offerings here: https://www.newconstructs.com/membership/
I love the concept and the implementation, and as a value investor ,I appreciate the service you provide. Keep up the great work!!
What is your coverage universe of Non US equities and Non US Mutual Funds and ETFs?
We currently cover ~250 non-US equities, and we do not cover international ETFs or mutual funds. You can see our entire coverage universe here.
http://www.google.com/...
Interview With Michael Mauboussin
John Rotonti: Which qualities lead to share outperformance over a long period of time?
Michael Mauboussin: There is no formula. The excess returns for high ROIC businesses are not exceptional, because the market knows they are high ROIC businesses.
The best answer is that a
stock starts off with low expectations and then consistently delivers results better than what the market anticipated. Not very helpful but accurate.