
Our Focus List Stocks: Long Model Portfolio, the best of our Long Ideas, underperformed the S&P 500[1] by 5.4% in 1H23. The Model Portfolio returned 8% compared to 14% for the S&P 500.
Despite this performance, the Model Portfolio has beaten the S&P 500 by 30% since the start of 2021.
For real-time tracking of this Model Portfolio, see the index Thematic created for it.
Figure 1: Focus List Stocks: Long vs. S&P 500 in 1H23
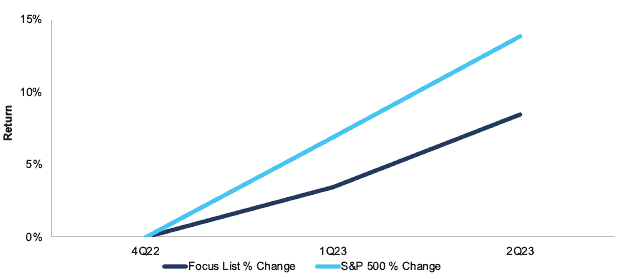
Sources: New Constructs, LLC
Figure 2 shows a detailed breakdown of the Model Portfolio’s performance, which includes all stocks present in the Model Portfolio at any point in 1H23.
Figure 2: 1H23 Performance of the Focus List Stocks: Long Model Portfolio
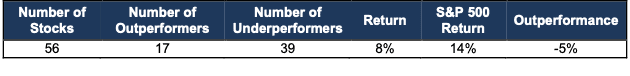
Sources: New Constructs, LLC
Performance includes stocks in the Model Portfolio as well as those removed during 1H23 (six stocks).
Underscoring just how important reliable fundamental research is in volatile markets, this Model Portfolio has beaten the S&P 500 by 30% since the start of 2021.
Figure 3: Focus List Stocks: Long Performance Since Beginning of 2021
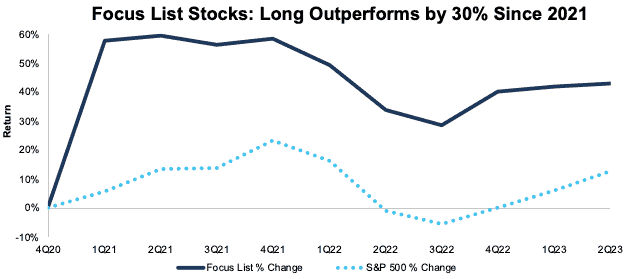
Sources: New Constructs, LLC
Professional and Institutional members get real-time updates and can track all Model Portfolios on our site. The Focus List Stocks: Long Model Portfolio leverages superior fundamental data, which provides a new source of alpha.
We’re here to help you navigate these turbulent times. Our uniquely rigorous fundamental research consistently earns SumZero’s #1 All-Time ranking, along with #1 rankings in several other categories.
This article was originally published on July 11, 2023.
Disclosure: David Trainer, Kyle Guske II, Hakan Salt, and Italo Mendonça receive no compensation to write about any specific stock, sector, style, or theme.
Questions on this report or others? Join our Society of Intelligent Investors and connect with us directly.
[1] Stocks are in the Focus List Model Portfolios for different periods of time as we open and close positions during the year. When measuring outperformance of the Focus List Model Portfolios, we compare each stock’s return to the S&P 500’s return for the time each is in the Focus List Model Portfolios. This approach provides an apples-to-apples comparison of how each stock performed vs. the S&P 500.