
Our Focus List Stocks: Long Model Portfolio[1], the best of our Long Ideas, rose 0.1% compared to -4.5% for the S&P 500 and outperformed by 4.6% in 1Q25. See Figure 1.
Figure 1: Focus List Stocks: Long (up 0.1%) vs. S&P 500 (down 4.5%) in 1Q25
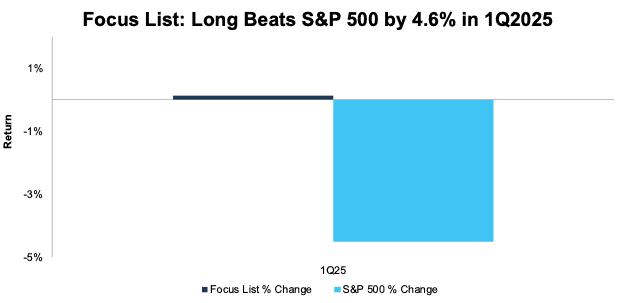
Sources: New Constructs, LLC
The Focus List Stocks: Long Model Portfolio has beaten the S&P 500 by 18% from the start of 2021 through 1Q25. See Figure 2. This outperformance underscores how important trustworthy research is.
Figure 2: Focus List Stocks: Long Performance Since Beginning of 2021
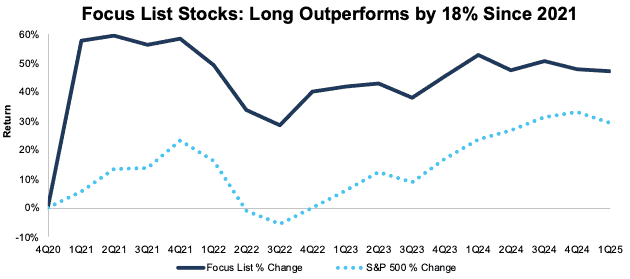
Sources: New Constructs, LLC
Figure 3 details the Model Portfolio’s performance, which includes all stocks present in the Model Portfolio at any point in 1Q25.
Figure 3: 1Q25 Performance of the Focus List Stocks: Long Model Portfolio
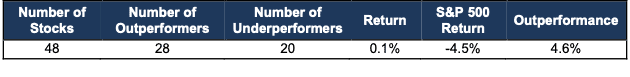
Sources: New Constructs, LLC
Performance includes stocks in the Model Portfolio in 1Q25 as well as those removed during the same time (0 stocks).
Professional and Institutional members get real-time updates and can track all Model Portfolios on our site. The Focus List Stocks: Long Model Portfolio leverages superior fundamental data, which provides a novel alpha.
We’re here to help you navigate these turbulent times. Our uniquely rigorous fundamental research consistently earns #1 rankings in several categories on SumZero.
Check Out the Indices Based on New Constructs Research
While we’re writing about how our Focus List Stocks: Long Model Portfolio finds winning stocks, we should highlight the indices we’ve developed with Bloomberg’s Index Licensing Group. Both outperformed the S&P 500 in 1Q25. See Figures 4 and 5.
- Bloomberg New Constructs Ratings VA-1 Index (ticker: BNCVA1T:IND)
- Bloomberg New Constructs 500 Index (ticker: B500NCT:IND)
Figure 4 compares the performance of the Very Attractive Stocks Index, managed by Bloomberg, to the S&P 500. In 1Q25, the Bloomberg New Constructs Ratings VA-1Index (ticker: BNCVAT1T:IND) was up 4.6% while the S&P 500 was down 4.6%.
Figure 4: Very Attractive-Rated Stocks Strongly Outperform the S&P 500 in 1Q25
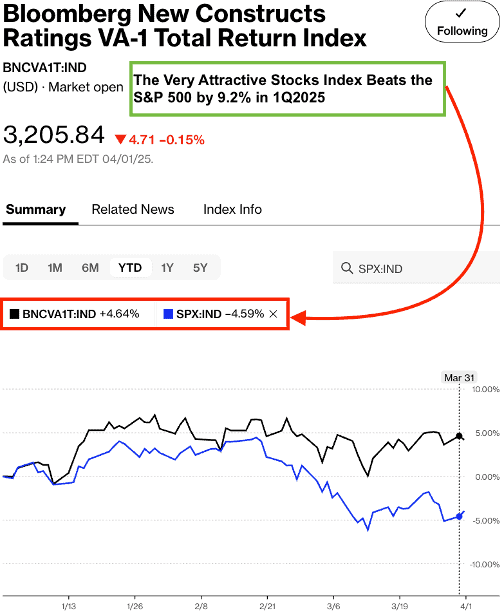
Sources: Bloomberg
Note: Past performance is no guarantee of future results.
Figure 5 compares the performance of the Bloomberg New Constructs 500 Total Return Index, managed by Bloomberg, to the S&P 500. In 1Q25, the Bloomberg New Constructs 500 Total Return Index (ticker: BNCVAT1T:IND) was down 3.6% while the S&P 500 was down 4.6%.
Figure 5: Bloomberg New Constructs 500 Index Strongly Outperforms the S&P 500 in 1Q25
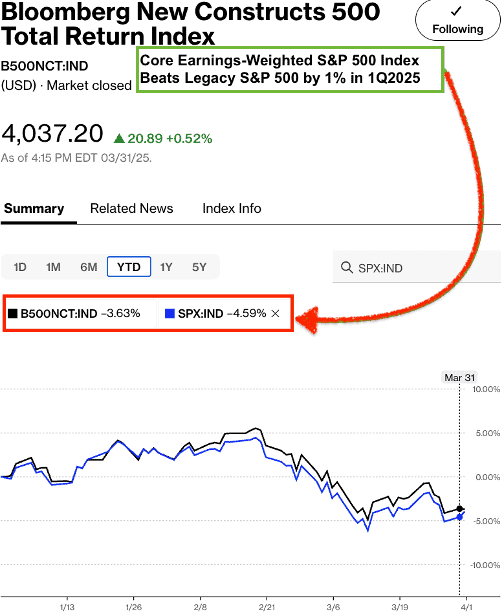
Sources: Bloomberg
Note: Past performance is no guarantee of future results.
This article was originally published on April 9, 2025.
Disclosure: David Trainer, Kyle Guske II, and Hakan Salt receive no compensation to write about any specific stock, sector, style, or theme.
Questions on this report or others? Join our online community and connect with us directly.
[1] Stocks are in the Focus List Model Portfolios for different periods of time as we open and close positions during the year. When measuring outperformance of the Focus List Model Portfolios, we compare each stock’s return to the S&P 500’s return for the time each is in the Focus List Model Portfolios. This approach provides an apples-to-apples comparison of how each stock performed vs. the S&P 500.