
Even many perma-bull institutions, such as Goldman Sachs and Morgan Stanley, have cautioned about the potential for a market pullback.
As speculation and risk-appetite start to fizzle away, the worst stocks will likely be the first ones to see corrections to their prices.
Investors should stay clear of these stocks at all costs, now more than ever.
For this reason, we created the Most Dangerous Stocks Model Portfolio. This Model Portfolio highlights the worst of the worst, the stocks with poor fundamentals and excessive valuations, so you can avoid them with confidence. To illustrate the level of risk these stocks present, we are featuring a stock from this Model Portfolio.
This free stock feature provides a summary of how we pick stocks for this Model Portfolio. It is not a full Danger Zone report, but it provides insight into the rigor of our research and approach to picking stocks. Whether you’re a subscriber or not, we think it is important that you’re able to see our research on stocks on a regular basis.
We’re proud to share our work. Please feel free to share it with your friends and family.
Keep an eye out for the free pick from our Most Attractive Stocks Model Portfolio, which will be published this week as well! The work that goes into that report is just as valuable.
We update this Model Portfolio monthly. The latest Most Attractive and Most Dangerous stocks Model Portfolios were updated and published for clients on August 6, 2025.
Free Most Dangerous Stock Pick: Carrier Global Corp (CARR)
Carrier Global’s (CARR: $66/share) net operating profit after tax (NOPAT) margin fell from 12% in 2019 to 10% in the TTM, while the company’s invested capital turns fell from 1.0 to 0.7 over the same time. Falling NOPAT margins and invested capital turns drive Carrier Global’s return on invested capital (ROIC) from 12% in 2019 to 7% in the TTM.
Carrier Global’s economic earnings, the true cash flows of the business, fell from $1.3 billion in 2019 to -$577 million in the TTM. Meanwhile, the company’s GAAP net income rose from $1.8 billion to $4.0 billion over the same time. Whenever GAAP earnings rise while economic earnings decline, investors should beware.
Figure 1: Carrier Global’s Economic vs GAAP Earnings Since 2019
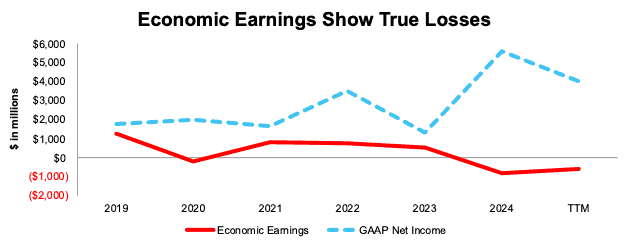
Sources: New Constructs, LLC and company filings
CARR Provides Poor Risk/Reward
Despite its poor and declining fundamentals, Carrier Global’s stock is priced for significant profit growth, and we believe the stock is overvalued.
To justify its current price of $66/share, Carrier Global must immediately improve its NOPAT margin to 15% (above company’s record margin of 12% in 2019 and 10% in the TTM) and grow revenue by 8% compounded annually through 2034 (above five-year CAGR of 2%). In this scenario, Carrier Global’s implied NOPAT would equal $7.0 billion in 2034, which is over 3x higher than the company’s record NOPAT of $2.2 billion in 2019. Contact us for the math behind this reverse DCF scenario. We think these expectations look overly optimistic.
Even if Carrier Global improves its NOPAT margin to 12% (equal to company’s record margin in 2019 compared to 10% in the TTM) and grows revenue 4% (above five-year CAGR of 2%) compounded annually through 2034, the stock would be worth no more than $35/share today – a 47% downside to the current stock price. Contact us for the math behind this reverse DCF scenario.
Each of these scenarios also assumes Carrier Global can grow revenue, NOPAT, and FCF without increasing working capital or fixed assets. This assumption is unlikely but allows us to create best case scenarios that demonstrate the high expectations embedded in the current valuation.
Critical Details Found in Financial Filings by Our Robo-Analyst Technology
Below are specifics on the adjustments we made based on Robo-Analyst findings in Carrier Global’s 10-K and 10-Q:
Income Statement: we made just under $6 billion in adjustments, with a net effect of removing under $4 billion in non-operating income. Professional members can see all adjustments made to the company’s income statement on the GAAP Reconciliation tab on the Ratings page on our website.
Balance Sheet: we made nearly $15 billion in adjustments to calculate invested capital with a net decrease of under $7 billion. One of the most notable adjustments was for other comprehensive income. Professional members can see all adjustments made to the company’s balance sheet on the GAAP Reconciliation tab on the Ratings page on our website.
Valuation: we made over $13 billion in adjustments to shareholder value, with a net decrease of under $12 billion. The most notable adjustment to shareholder value was for total debt. Professional members can see all adjustments to the company’s valuation on the GAAP Reconciliation tab on the Ratings page on our website.
This article was originally published on August 15, 2025.
Disclosure: David Trainer, Kyle Guske II, and Hakan Salt receive no compensation to write about any specific stock, style, or theme.
Questions on this report or others? Join our online community and connect with us directly.