Picking from the multitude of style ETFs is a daunting task. There are as many as 42 in any given style and at least 223 ETFs across all styles.
Why are there so many ETFs? The answer is: because ETF providers are making lots of money selling them. The number of ETFs has little to do with serving investors’ best interests. Below are three red flags investors can use to avoid the worst ETFs:
- Inadequate liquidity
- High fees
- Poor quality holdings
I address these red flags in order of difficulty to overcome. Advice on How to Find the Best Style ETFs is here.
How To Avoid ETFs with Inadequate Liquidity
This is the easiest issue to avoid and my advice is simple: Avoid all ETFs with less than $100 million in assets. Low levels of liquidity can lead to a discrepancy between the price of the ETF and the underlying value of the securities it holds. In addition, low asset levels tend to mean lower volume in the ETF and large bid-ask spreads.
How To Avoid High Fees
ETFs should be cheap, but not all of them are. The first step here is to measure what is cheap and expensive.
To ensure you are paying at or below average fees, invest only in ETFs with an expense ratio below 0.44%, which is the average total annual cost (TAC) of the 223 U.S. equity style ETFs I cover. Weighting the TAC by assets under management, the average expense ratio is lower at 0.19%. The lower weighted-average TAC is a good sign that investors are putting money in the cheaper ETFs.
Figure 1 shows the most and least expensive style ETFs in the US equity universe based on total annual costs. AdvisorShares and Huntington each provide two of the five most expensive style ETFs, while Schwab provides three of the five least expensive ETFs.More on general sector ETF costs is here.
Figure 1: Most and Least Expensive ETFs
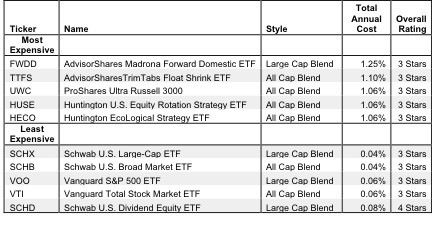 Sources: New Constructs, LLC and company filings
AdvisorShares Madrona Forward Domestic ETF (FWDD) and AdvisorShares TrimTabs Float Shrink ETF (TTFS) are the two most expensive U.S. equity style ETFs I cover. Schwab U.S. Large-Cap ETF (SCHX) and Schwab U.S. Broad Market ETF (SCHB) are the two least expensive. In addition to being one of the five least expensive, Schwab U.S. Dividend Equity ETF (SCHD) ranks well among style ETFs in general and has over $1.1 billion in assets. Schwab U.S. Dividend Equity ETF (SCHD) is my third top-rated style ETF overall, while also being the fifth least expensive.
Interestingly, AdvisorShares TrimTabs Float Shrink ETF (TTFS), is the next most expensive ETF in Figure 1, ranking 11th among all the style ETFs I cover overall despite being among the five most expensive. TTFS holds one of the strongest portfolios among the ETFs that I cover.
These observations underscore why investors should not choose ETFs based only on price. The quality of holdings matters more than price in making an ETF attractive for investors.
How To Avoid ETFs with the Worst Holdings
This step is by far the hardest, but it is also the most important because an ETF’s performance is determined more by its holdings than its costs. Figure 2 shows the ETFs within each style with the worst holdings or portfolio management ratings. The ETFs are listed in descending order by style per my style ratings, detailed in my 3Q Style Rankings report.
Figure 2: Style ETFs With the Worst Holdings
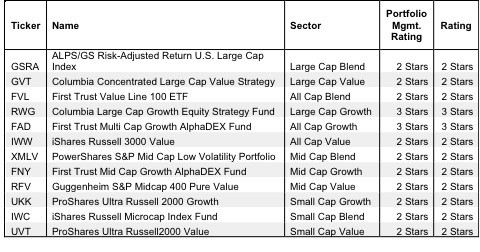 Sources: New Constructs, LLC and company filings
My overall ratings on ETFs are based primarily on my stock ratings of their holdings. My firm covers over 3000 stocks and is known for the due diligence done on each stock we cover.
First Trust ETFs appear more often than any other provider in Figure 2, which means they offer the most ETFs with the worst holdings. The worst-rated ETFs in the All Cap Blend, All Cap Growth, and Mid Cap Growth categories all belong to First Trust: First Trust Value Line 100 ETF (FVL), First Trust Multi Cap Growth AlphaDEX Fund (FAD), and First Trust Mid Cap Growth AlphaDEX Fund (FNY).
Do Not Trust ETF Labels
Many ETFs are labeled “index” ETFs. Naturally, many investors might assume that having “index” in the ETF’s name means all the holdings are the same or the provider cannot influence the nature of the holdings, but that is not true.
For example, of the three “index” ETFs in the Mid Cap Growth style, only one gets a Neutral rating while two get a Dangerous rating. How is that possible if they are supposed to hold the same stocks? The answer is that they do not hold the same stocks.
There is no overlap in the top 5 holdings among these three ETFs. Their portfolios are not close to being the same. And there is a meaningful difference in the quality of holdings.
SPDR S&P 400 Mid Cap Growth ETF (MDYG) and iShares Morningstar Mid Growth Index Fund (JKH) get 2-star or a Dangerous ratings because they have more Dangerous-rated holdings. iShares Russell Midcap Growth Index (IWP) get 3-stars and has more Neutral-rated holdings.
Hence, the “index” label, for Mid Cap Growth ETFs, is misleading, as it does not mean that these ETFs have the same portfolio of holdings. For more on how the index label is misleading, see “Index Label Myths.”
The point is that investors cannot trust the “index” label to mean that all the ETFs or mutual funds with that label hold a standard portfolio of stocks.
The Danger Within
Buying an ETF without analyzing its holdings is like buying a stock without analyzing its business and finances. As Barron’s says, investors should know the Danger Within. Put another way, research on ETF holdings is necessary due diligence because an ETF’s performance is only as good as its holdings’ performance.
PERFORMANCE OF ETF’s HOLDINGs = PERFORMANCE OF ETF
Note that no ETFs with a dangerous portfolio management rating earn an overall rating better than two stars. These scores are consistent with my belief that the quality of an ETF is more about its holdings than its costs. If the ETF’s holdings are dangerous, then the overall rating cannot be better than dangerous because one cannot expect the performance of the ETF to be any better than the performance of its holdings – no matter how cheap it may be.
Find the ETFs with the worst overall ratings on my ETF screener. More analysis of the Best Style ETFs is here.
Best & Worst Stocks In these ETFs
Southwest Airlines (LUV) is one of my least favorite stocks in FWDD’s top five holdings and earns my Very Dangerous rating. There is much to dislike about LUV, starting with the fact that it has not posted positive economic earnings going back to 2000 when my model begins. Additionally, its return on invested capital (ROIC) of 3% puts it in the bottom quintile of all the companies I cover. Nevertheless, LUV is priced for significant growth by the market at ~$14/share. To justify this price, the company must grow after-tax profit (NOPAT) by 10% for the next 11 years. For a few companies, those profit growth expectations might be reasonable. However, with LUV’s shaky history and with NOPAT falling as much as 40% in some recent years, investors may be headed for a crash.
Wal-Mart (WMT) is one of my favorite stocks held by SCHD and earns my Attractive rating. WMT earns my highest rating due in large part to its steadily rising NOPAT and strong return on invested capital (ROIC). Its ROIC of 12% is in the top quintile of all the companies I cover. As I noted in my June article on WMT, the company’s ROIC has remained high since 1998, a remarkable achievement considering Wal-Mart’s impressive growth during these years.
The current share price of ~$78 gives WMT a price to economic book value ratio of 0.8, meaning that the market is anticipating a permanent 20% decline in Wal-Mart’s NOPAT. WMT is highly profitable and significantly undervalued, an ideal combination for investors. SCHD’s allocation to WMT and other Attractive-or-better rated stocks, combined with its position in the top five cheapest ETFs make it an Attractive, (4-star) fund.
André Rouillard contributed to this report.
Disclosure: David Trainer and André Rouillard receive no compensation to write about any specific stock, sector, or theme.