Picking from the multitude of style ETFs is a daunting task. There are as many as 40 in any given style and at least 217 ETFs across all styles.
Why are there so many ETFs? The answer is: because ETF providers are making lots of money selling them. The number of ETFs has little to do with serving investors’ best interests. Below are three red flags investors can use to avoid the worst ETFs:
- Inadequate liquidity
- High fees
- Poor quality holdings
I address these red flags in order of difficulty. Advice on How to Find the Best Style ETFs is here.
How To Avoid ETFs with Inadequate Liquidity
This is the easiest issue to avoid and my advice is simple. Avoid all ETFs with less than $100 million in assets.
How To Avoid High Fees
ETFs should be cheap, but not all of them are. The first step here is to measure what is cheap and expensive.
To ensure you are paying at or below average fees, invest only in ETFs with an expense ratio below 0.45%, which is the average total annual cost (TAC) of the 217 US equity style ETFs I cover. Weighting the (TAC) by assets under management, the average expense ratio is lower at 0.19%. A lower weighted average is a good sign that investors are putting money in the cheaper ETFs.
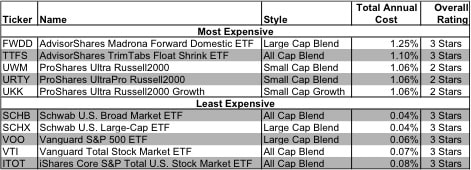
Figure 1 shows the most and least expensive style ETFs in the US equity universe based on total annual costs. ProShares provides three of the five most expensive style ETFs. ProShares provides all five of the most expensive sector ETFs. More on sector ETF costs is here.
Figure 1: Most & Least Expensive ETFs (as of 12/18/2012)
AdvisorShares Madrona Forward Domestic ETF (FWDD) and AdvisorShares TrimTabs Float Shrink ETF (TTFS) are the two most expensive US equity style ETFs I cover. Schwab U.S. Broad Market ETF (SCHB) is the least expensive. Vanguard Total Stock Market ETF (VTI) ranks well also and it has over $24 billion in assets. Ironically, ProShares’ Ultra Russell2000 (UWM), UltraPro Russell2000 (URTY) and Ultra Russell2000 Growth (UKK), are the best-rated ETFs in Figure 1 even though they are among the most expensive. All of the cheapest ETFs do no better than a neutral or 3-star rating. UWM, URTY and UKK earn good ratings because the quality of their holdings is strong enough to justify a higher cost. On the other hand, the cheaper ETFs hold poorer stocks. And no matter how cheap an ETF, if it holds bad stocks, its performance will be bad.
This result highlights why investors should not choose ETFs based only on price. The quality of holdings matters more than price.
How To Avoid ETFs with the Worst Holdings
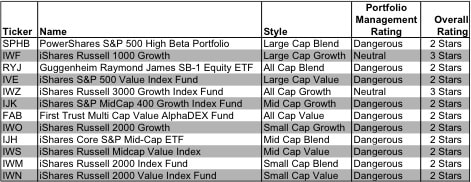
This step is by far the hardest, but it is also the most important because an ETF’s performance is determined more by its holdings than its costs. Figure 2 shows the ETFs within each style with the worst holdings or portfolio management ratings. The styles are listed in descending order by overall rating as detailed in my 4Q Style Rankings report.
Figure 2: Style ETFs With Worst Holdings (as of 12/18/12)
My overall ratings on ETFs are based primarily on my stock ratings of their holdings. My firm covers over 3000 stocks and is known for the due diligence done on each stock we cover.
iShares’ ETFs appear more often than any other provider in Figure 2, which means they offer the most ETFs with the worst holdings. iShares Core S&P Mid-Cap ETF (IJH) has the worst holdings of all mid cap blend ETFs. iShares Russell 1000 Growth (IWF), iShares S&P 500 Value Index Fund (IVE), iShares Russell 3000 Growth Index Fund (IWZ), iShares S&P MidCap 400 Growth Index Fund (IJK), iShares Russell 2000 Growth (IWO), iShares Russell Midcap Value Index (IWS), iShares Russell 2000 Index Fund (IWM), iShares Russell 2000 Value Index Fund (IWN) have the worst holdings of all ETFs in their styles.
Do Not Trust ETF Labels
Many ETFs are labeled “index” ETFs. Naturally, many investors might assume that having “index” in the ETF’s name means all the holdings are the same or the provider cannot influence the nature of the holdings, but that is not true.
For example, of the three “index” ETFs in the mid-cap growth style, two get a neutral rating while one gets a Dangerous rating. How is that possible if they are supposed to hold the same stocks? The answer is that they do not hold the same stocks.
There is no overlap in the top 5 holdings among these three ETFs. Their portfolios are not close to being the same. And three is a meaningful difference in the quality of holdings.
iShares S&P MidCap 400 Growth Index Fund (IJK) gets 2-stars or a Dangerous rating because it has dangerous-rated holdings. iShares Morningstar Mid Growth Index Fund (JKH) and iShares Russell Midcap Growth Index (IWP) get 3-stars and have neutral-rated holdings.
The “index” label, for mid-cap growth ETFs, is misleading as it does not mean that these ETFs have the same portfolio of holdings. For more on how the index label is misleading, see “Danger Zone 12/31/2012: iShares S&P MidCap 400 Growth Index Fund (IJK)”.
The point is that investors cannot trust the “index” label to mean that all the ETFs or mutual funds with that label hold a standard portfolio of stocks.
The Danger Within
Buying an ETF without analyzing its holdings is like buying a stock without analyzing its business and finances. As Barron’s says, investors should know the Danger Within. Put another way, research on ETF holdings is necessary due diligence because an ETF’s performance is only as good as its holdings’ performance.
PERFORMANCE OF ETF’s HOLDINGs = PERFORMANCE OF ETF
Note that no ETFs with a dangerous portfolio management rating earn an overall rating better than two stars. These scores are consistent with my belief that the quality of an ETF is more about its holdings than its costs. If the ETF’s holdings are dangerous, then the overall rating cannot be better than dangerous because one cannot expect the performance of the ETF to be any better than the performance of its holdings.
Find the ETFs with the worst overall ratings on my ETF screener. More analysis of the Best Sector ETFs is here.
Best & Worst Stocks In these ETFs
US Steel (X) is one of my least favorite stocks held by SPHB. As detailed in US Steel (X) At Risk Of Pension Pressure, this stock could see significant downward pressure as more investors become aware of the $5.2 billion in liabilities related to its “Pension Benefits”, “Other Benefits” and “Other postemployment benefits” plans. A loophole in GAAP accounting minimizes, at least temporarily, the impact of big pension liabilities on reported earnings. Specifically, US Steel boosted its 2011 earnings by increasing its expected return on plan assets (“EROPA”) assumption for its pensions to 7.79%[1], up from 7.75% in 2010. Page F-40 in US Steel’s 2011 10-K filing has the details. For those that say all of this information is already baked into the stock price, I suggest you look again. According to my discounted cash flow model, to justify the stock valuation at $25.71/share, the company has to grow its after-tax cash flow (NOPAT) by 5% compounded annually for nearly 15 years. That is a rather high growth rate for a long time for a commodity business.
Oracle Corporation (ORCL) is one of my favorite stocks held by IWF. ORCL is a leading provider of database products and services. Despite being the leader in an industry on which our data-centric world depends, ORCL’s stock (at ~$34.50/share) has a Price-to-Economic Book Value of .98, which means the market expects its after-tax profits to permanently decline by 2%. This pessimistic valuation is surprising given that ORCL has had positive economic earnings every year since 1998 and has grown them at an annual CAGR of 21%. It is not often that an industry leader that creates value for shareholders year-after-year is sold at a discount. ORCL earns my Very Attractive rating.
Disclosure: I own ORCL. I receive no compensation to write about any specific stock, sector or theme.

