Picking from the multitude of style mutual funds is a daunting task. There are as many as 1,019 in any given style and at least 6,130 mutual funds across all styles.
The number of mutual funds has little to do with serving investors’ best interests. Providers make a great deal of money selling mutual funds, especially the worst ones. Below are three red flags to avoid the worst funds
- Inadequate liquidity
- High fees
- Poor quality holdings
I address these red flags in order of difficulty. Advice on How to Find the Best Style Mutual Funds is here.
How To Avoid Mutual Funds with Inadequate Liquidity
This is the easiest issue to avoid and my advice is simple. Avoid all mutual funds with less than $100 million in assets. Low levels of liquidity can lead to a discrepancy between the price of the fund and the underlying value of the securities it holds. This makes it difficult to predict future performance.
How To Avoid High Fees
Mutual funds should be cheap, but not all of them are. The first step here is to measure true, all-in expense.
The difficulty with mutual funds is that there are multiple costs in any given fund. The expense ratio is the most obvious, but many funds also have significant transaction costs and front-end load costs. Less apparent fees can drive the cost of a fund to far higher than its expense ratio. My measurement of total annual costs reflects the all-in cost of a minimum investment in a fund for three years (the average holding period for mutual funds).
To ensure you are paying at or below average fees, invest only in mutual funds with total annual costs below 2.53%, which is the average total annual cost of the 653 US equity sector mutual funds I cover. Weighting the (TAC) by assets under management, the average cost is lower at 1.54%. The lower weighted-average TAC is a good sign that investors are putting money in the cheaper mutual funds.
Figure 1 shows the most and least expensive style funds in the US equity universe based on total annual costs. Vanguard and Fidelity combine to provide the five cheapest mutual funds, while the five most expensive are split between multiple providers.
Figure 1: Most and Least Expensive Sector Mutual Funds
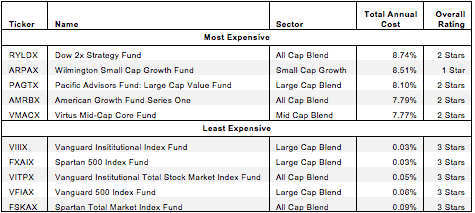
Sources: New Constructs, LLC and company filings
The five cheapest mutual funds each have at least $25 billion in assets, while of the most expensive only one (ARPAX) has even $100 million. Investors seem to be doing a good job already of putting their money in cheap mutual funds instead of more expensive ones.
ARPAX is a good example of the difficulty involved in properly assessing mutual fund costs. Its low expense ratio has helped to fool investors into putting $140 million into it. Less obvious costs, like front-end load and transaction fees, hurt investors and make it very difficult for this fund to offer acceptable returns.
Figure 1 clearly shows that the five cheapest funds all get a higher rating than the five most expensive. However, none of the cheap funds earn higher than a 3 Star (Neutral) rating. Low costs are nice, but low costs cannot create returns, only quality holdings can.
How To Avoid Mutual Funds with the Worst Holdings
This step is by far the hardest, but it is also the most important because a mutual fund’s performance is determined more by its holdings than its costs. Figure 2 shows the mutual funds within each style with the worst holdings or portfolio management ratings. The mutual funds are listed in descending order by style per my style ratings, detailed in my 1Q Style Rankings report.
Figure 2: Style Mutual Funds With The Worst Holdings
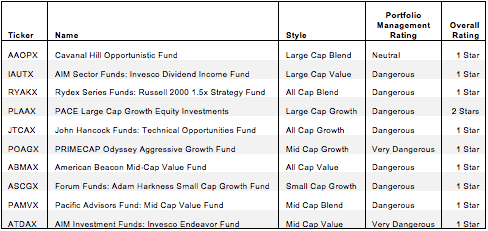 Sources: New Constructs, LLC and company filings
My overall ratings on mutual funds are based primarily on my stock ratings of their holdings. My firm covers over 3000 stocks and is known for the due diligence done on each stock we cover.
The worst style mutual funds come from a variety of different providers. No single provider has more than two mutual funds in figure 2.
Do Not Trust Mutual Fund Labels
Many mutual funds are labeled “index” funds. Naturally, many investors might assume that having “index” in the mutual fund’s name means all the holdings are the same or the provider cannot influence the nature of the holdings, but that is not true.
For example, there are two funds labeled “index” funds in the mid-cap value style. One would think, then, that Vanguard Mid-Cap Value Index Fund (VMVIX) and John Hancock Funds II: Mid Cap Value Index Fund (JVIOX) would have the same holdings. In fact, the two funds differ in three out of their top five holdings.
Investors who just look at the label of a mutual fund without examining the holdings don’t really know what they are getting.
The Danger Within
Buying a mutual fund without analyzing its holdings is like buying a stock without analyzing its business and finances. Research on mutual fund holdings is necessary due diligence because an mutual fund’s performance is only as good as its holdings’ performance.
PERFORMANCE OF MUTUAL FUND’S HOLDINGs = PERFORMANCE OF MUTUAL FUND
Note that no mutual funds with a dangerous portfolio management rating earn an overall rating better than two stars. These scores are consistent with my belief that the quality of a mutual fund is more about its holdings than its costs. If the mutual fund’s holdings are dangerous, then the overall rating cannot be better than dangerous because one cannot expect the performance of the mutual fund to be any better than the performance of its holdings – no matter how cheap it may be.
Find the mutual funds with the worst overall ratings on my free ETF and mutual fund screener. More analysis of the Best Style mutual funds is here.
Worst Stocks In these Mutual Funds
Duke Energy Corp (DUK) is one of my least favorite stocks held by IAUTX and earns my Dangerous rating. Over the past 10 years, DUK has not had a return on invested capital (ROIC) above 5%. These consistently low levels of return have led to DUK making negative economic earnings every year over the same time period while accounting earnings have been positive. Combining $41 billion in total adjusted debt (more than 80% of the market cap), $10 billion in deferred tax liabilities (20% of market cap) and $2.2 billion in underfunded pensions (4% of market cap) paints a somber picture for equity investors. The current valuation of ~$73/share paints a very happy picture, however. This valuation implies that DUK’s after tax profit (NOPAT) will grow organically by over 5% compounded annually for ten years. This level of organic growth is a tough ask for a utility company. In the past DUK has grown profits by via acquisition, which is why its ROIC is so low. Accounting earnings may be rising but the economic of this business do not look as good. High expectations for future cash flows mean high risk for investors.
Sam McBride contributed to this report.
Disclosure: David Trainer and Sam McBride receive no compensation to write about any specific stock, sector, or theme.