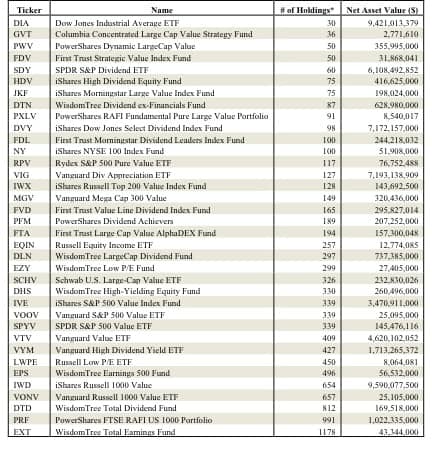
There are 36 “large cap value” ETFs. Per Figure 1, these 36 ETFs have drastically different stock holdings and, therefore, allocations. The lowest number of holdings is 30 while the highest is 1178.
How do investors pick the ETF that will deliver the best performance?
Figure 1: Holdings Count of Large Cap Value ETFs

As detailed in my prior article on how to find the best tech ETFs, that question was posed to the major ETF issuers at Mornigstar’s ETF conference in Chicago a couple weeks ago. The issuers admitted that the landscape for ETFs is a bit cluttered and needs attrition. They did not, however, offer any solutions.
Like most Wall Street types, the issuers are focused on how to profit from ETFs not how to help investors profit from ETFs. Thank goodness for independent research.
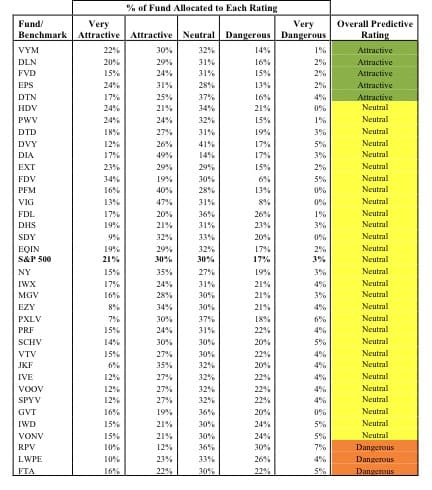
To identify the best ETFs within a given category, investors need a predictive rating for ETFs based on analysis of the underlying quality of earnings and valuation of the stocks in each ETF. See Figure 2.
Figure 2: Investment Merit of Allocations

Too many investors have been misled to believe they can trust the ETF label, i.e. category, and believe that all ETFs within a certain category are the same when they are not.
For example, the Vanguard High Dividend Yield ETF (VYM), our top pick among large cap value ETFs, holds 427 stocks while First Trust Large Cap Value AlphaDEX fund (FTA), our worst-rated large cap value ETF, holds only 194. PowerShares Dynamic LargeCap Value (PWV) holds only 50 stocks and gets a neutral rating like the S&P 500.
Predictive ratings empower advisors and their clients to make more informed decisions.
My predictive ratings come from bottoms-up analysis of the quality of a fund’s. This research provides:
- Intelligent differentiation between funds
- Due diligence to protect against owning funds with stocks that might blow up
As highlighted by Barrons’ The Danger Within, for research on funds to rival the quality of research on stocks, fund research must be based on rigorous analysis of all the holdings within a fund.
Below is a sample of our bottoms-up analysis on stocks that are included in the large cap value ETFs. Notice there are good stocks and bad stocks. The only way to know what a fund holds is to look.
- Johnson & Johnson (JNJ – very attractive rating): Current valuation of this pharma stalwart implies the company’s after-tax cash flow (NOPAT) will decline by 20% next year and never grow from that depressed level. My model reveals strong economic earnings and a top quintile ROIC of 15% for JNJ.
- Exxon Mobil (XOM – attractive rating): The energy giant earns an 11% ROIC and has a valuation that implies the company will never grow its profits beyond their current level.
- AT&T (T – dangerous rating): My model shows the AT&T has misleading earnings: accounting profits are positive and rising while economic profits are negative and declining. At the same time, the stock’s valuation suggests the company’s profits will grow by 30% over the next several years. It is hard to grow profits when you don’t have any.
Click here to get more sample reports on ETFs.
Disclosure: I receive no compensation to write about any specific stock, sector or theme.
1 Response to "Large-Cap Value Has 36 Aliases in ETF World"
[…] See original here: Large-Cap Value Has 36 Aliases in ETF World – Hidden Gems and … […]