
The Mid Cap Value style ranks ninth out of the twelve fund styles as detailed in my Style Rankings for ETFs and Mutual Funds report. It gets my Dangerous rating, which is based on aggregation of ratings of 16 ETFs and 166 mutual funds in the Mid Cap Value style as of July 30, 2014. Prior reports on the best & worst ETFs and mutual funds in every sector and style are here.
Figures 1 and 2 show the five best and worst-rated ETFs and mutual funds in the style. Not all Mid Cap Value style ETFs and mutual funds are created the same. The number of holdings varies widely (from 21 to 2788). This variation creates drastically different investment implications and, therefore, ratings. The best ETFs and mutual funds allocate more value to Attractive-or-better-rated stocks than the worst, which allocate too much value to Neutral-or-worse-rated stocks.
To identify the best and avoid the worst ETFs and mutual funds within the Mid Cap Value sector, investors need a predictive rating based on (1) the stocks ratings of the holdings, (2) the all-in expenses of each ETF and mutual fund, and (3) the fund’s rank compared to all other ETFs and mutual funds. As a result, only the cheapest funds with the best holdings receive Attractive or better ratings. Investors need not rely on backward-looking ratings. My fund rating methodology is detailed here.
Investors seeking exposure to the Mid Cap Value style should buy one of the Attractive-or-better rated ETFs or mutual funds from Figures 1 and 2.
Get my ratings on all ETFs and mutual funds in this style by searching for Mid Cap Value on my mutual fund and ETF screener.
Figure 1: ETFs with the Best & Worst Ratings – Top 5
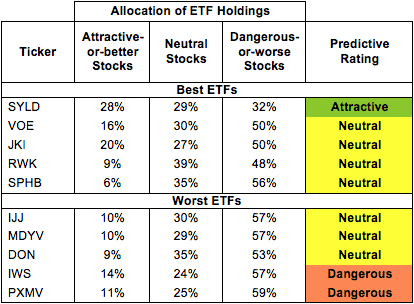
* Best ETFs exclude ETFs with TNAs less than $100 million for inadequate liquidity.
Sources: New Constructs, LLC and company filings
First Trust RBA Quality Income ETF (QINC) and QuantShares U.S. Market Neutral Value Fund ETF (CHEP) are excluded from Figure 1 because their total net assets (TNA) are below $100 million and do not meet our liquidity minimums.
Figure 2: Mutual Funds with the Best & Worst Ratings – Top 5
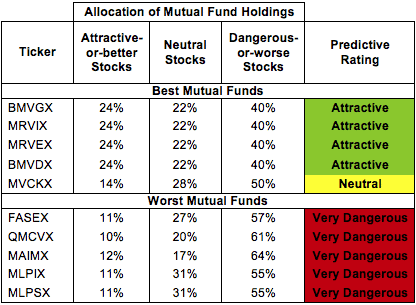
* Best mutual funds exclude funds with TNAs less than $100 million for inadequate liquidity.
Sources: New Constructs, LLC and company filings
Cambria Shareholder Yield ETF (SYLD) is my top-rated Mid Cap Value ETF and BMO Funds, Inc: BMO Mid-Cap Value Fund (BMVGX) is my top-rated Mid Cap Value mutual fund. Both earn my Attractive rating.
PowerShares Fundamental Pure Mid Value Portfolio ETF (PXMV) is my worst-rated Mid Cap Value ETF and ProFunds: Mid-Cap Value ProFund (MLPSX) is my worst-rated Mid Cap Value mutual fund. PXMV earns my Dangerous rating and MLPSX earns my Very Dangerous rating.
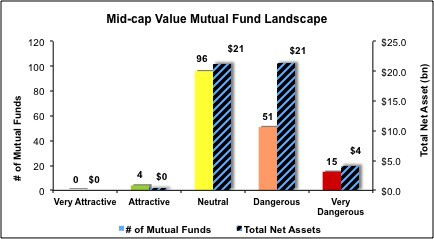
Figure 3 shows that 277 out of the 2178 stocks (over 16% of the market value) in Mid Cap Value ETFs and mutual funds get an Attractive-or-better rating. However, only 2 out of 16 Mid Cap Value ETFs (less than 1% of total net assets) and 4 out of 166 Mid Cap Value mutual funds (less than 1% of total net assets) get an Attractive-or-better rating.
The takeaways are: mutual fund managers allocate too much capital to low-quality stocks and Mid Cap Value ETFs hold poor quality stocks.
Figure 3: Mid Cap Value Style Landscape For ETFs, Mutual Funds & Stocks
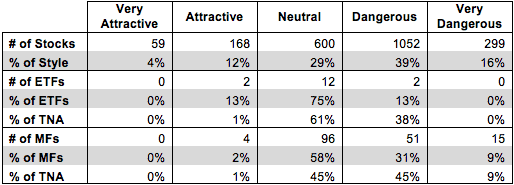
Sources: New Constructs, LLC and company filings
As detailed in “Cheap Funds Dupe Investors”, the fund industry offers many cheap funds but very few funds with high-quality stocks, or with what I call good portfolio management.
Investors need to tread carefully when considering Mid Cap Value ETFs and mutual funds, as only 2 ETFs and 4 mutual funds in the Mid Cap Value style allocate enough value to Attractive-or-better-rated stocks to earn an Attractive rating.
Medifast Inc. (MED) is one of my favorite stocks held by Mid Cap Value ETFs and mutual funds and earns my Attractive rating. Since going public in 2005, MED has grown after-tax profits (NOPAT) by 35% compounded annually. Currently, MED earns a return on invested capital (ROIC) of 35%, placing it in the top quintile of all companies I cover. The company has also generated positive and increasing economic earnings for the past eight years. Despite this impressive track record of profit growth, MED is priced for low profit growth going forward. At its current price of ~$33/share, MED has a price to economic book value (PEBV) ratio of 1.2. This ratio implies the market expects MED to grow NOPAT by no more than 40% for the remaining life of the company. This expectation seems rather low given MED’s ability to grow NOPAT by 35% compounded annually since 2005. High profit growth and low market expectations make MED a stock to buy.
Sempra Energy (SRE) is one of my least favorite stocks held by Mid Cap Value ETFs and mutual funds and earns my Very Dangerous rating. Over the past eight years, SRE has grown NOPAT by less than 1% compounded annually, and the company’s ROIC has fallen from 9% to a bottom quintile 4%. Despite the declining ROIC and stagnant profits, the market currently places a high premium on SRE. In order to justify its current price of ~$105/share, SRE must grow NOPAT by 8% compounded annually for the next 13 years. Not many Utilities can deliver that much profit growth. SRE’s poor track record and high valuation make it Very Dangerous.
Figures 4 and 5 show the rating landscape of all Mid Cap Value ETFs and mutual funds.
My Style Rankings for ETFs and Mutual Funds report ranks all styles and highlights those that offer the best investments.
Figure 4: Separating the Best ETFs From the Worst Funds
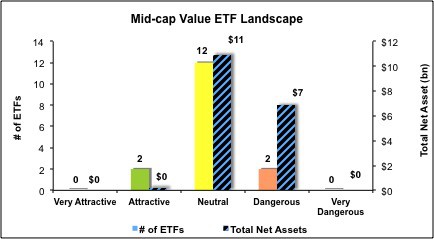
Sources: New Constructs, LLC and company filings
Figure 5: Separating the Best Mutual Funds From the Worst Funds
Sources: New Constructs, LLC and company filings
Review my full list of ratings and rankings along with reports on all 16 ETFs and 166 mutual funds in the Mid Cap Value style.
Kyle Guske II contributed to this report.
Disclosure: David Trainer and Kyle Guske II receive no compensation to write about any specific stock, sector, style or theme.