
Platinum and higher members get access to our sector & industry research, which leverages our more reliable fundamental data. Access includes:
- overall and component ratings for each sector and industry
- sector- and industry-level fundamental analysis of economic earnings, return on invested capital (ROIC), free cash flow, economic book value, and price-to-economic book value (PEBV), and more
- the best and worst stocks, ETFs, and mutual funds in each sector and industry
Access these ratings by clicking the Ratings tab and, then, clicking on “Sectors”. Use the sector and industry dropdown menus to get more details. See Figure 1.
Figure 1: Access Sector Level Research from the Ratings Page
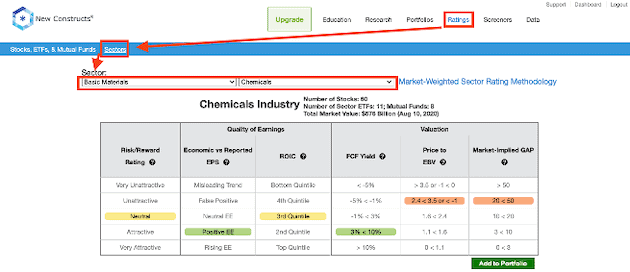
Sources: New Constructs, LLC
We also provide Analyst Commentary, which includes sector and industry outlook/investment recommendations, and related research, per Figure 2.
Figure 2: Analyst Commentary on Sectors
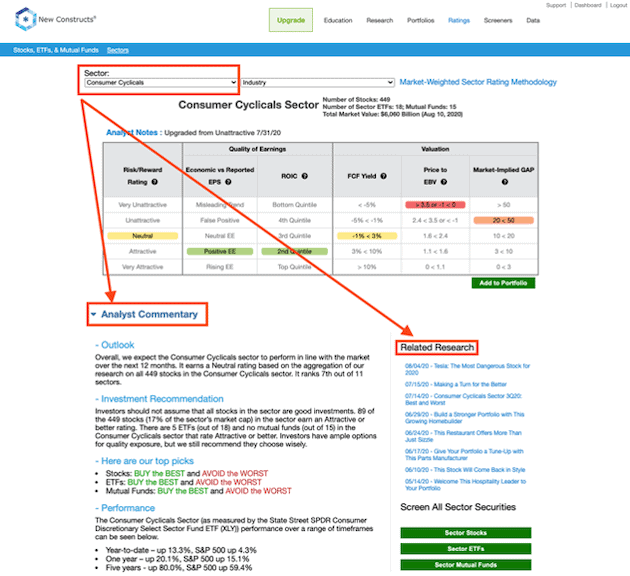
Sources: New Constructs, LLC
Below the Analyst Commentary, we provide research on a sector/industry’s rating distribution, the best stocks, ETFs, and mutual funds in the sector/industry, five-year trend in key metrics, and average & median values for common metrics over the TTM period and last two years. See images below for more details.
Sector Rating Distribution
Get details on the distribution of ratings in a specific sector or industry, broken out by number of stocks and percent of market value. See Figure 3.
Figure 3: Ratings Distribution by Sector
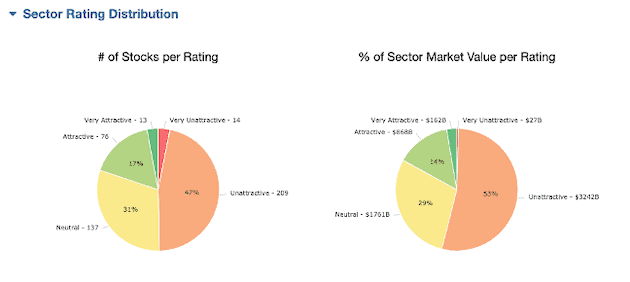
Sources: New Constructs, LLC
Best & Worst Industry Stocks, ETFs, and Mutual Funds
Get the best and worst stocks, ETFs, and mutual funds in a sector or industry. Pro and higher members also get details on the ROIC, FCF Yield, PEBV ratio, and market implied growth appreciation period (GAP) for each ticker, per Figure 4.
Figure 4: The Best & Worst Stocks, ETFs, and Mutual Funds in a Sector
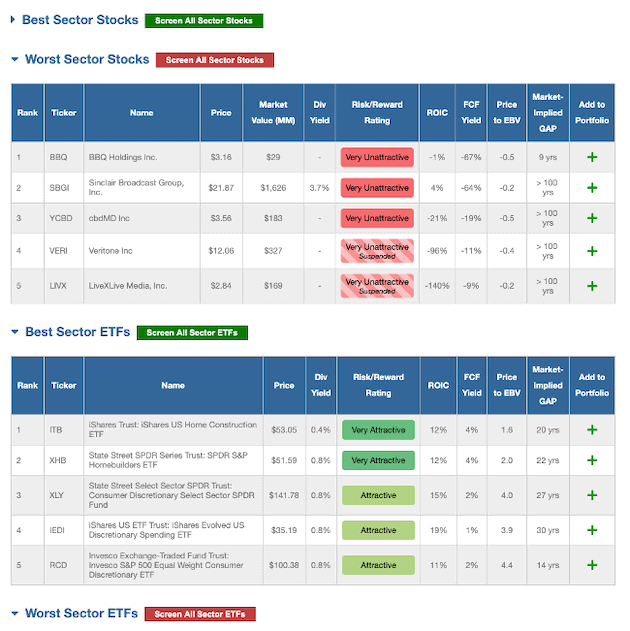
Sources: New Constructs, LLC
Sector & Industry Fundamentals in Charts
Get a five-year history of a sector or industry’s key metrics, which include economic vs. reported earnings, ROIC vs. WACC, FCF yield, PEBV ratio, and more. See Figure 5.
Figure 5: Key Metric Trends by Sector & Industry
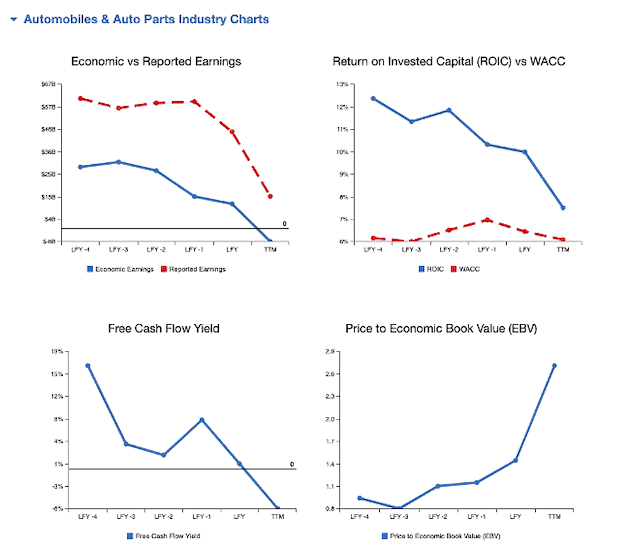
Sources: New Constructs, LLC
Key Data & Metrics for each Sector & Industry
Get the median, market weighted average, and simple average of several metrics, such as revenue growth, EPS growth, NOPAT margin, ROIC, WACC, and more. Also, get aggregated sector or industry data for revenue, GAAP net income, NOPAT, and more. See Figure 6.
Figure 6: In Depth Sector & Industry Data
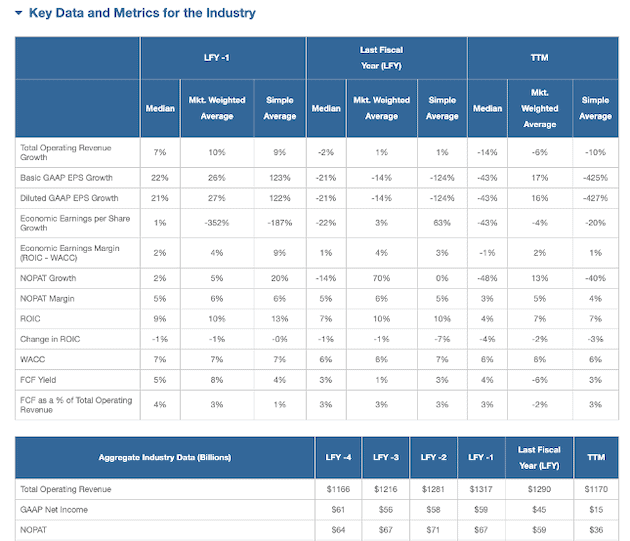
Sources: New Constructs, LLC
Contact us at support@newconstructs.com if you have any questions.
This article originally published on March 29, 2021.
Disclosure: David Trainer, Kyle Guske II, and Matt Shuler receive no compensation to write about any specific stock, style, or theme.
Follow us on Twitter, Facebook, LinkedIn, and StockTwits for real-time alerts on all our research.