
In an updated edition of Core Earnings: New Data & Evidence, professors at Harvard Business School (HBS) & MIT Sloan empirically show that our “novel dataset” is superior to “Street Earnings” from Refinitiv’s IBES, owned by Blackstone (BX) and Thomson Reuters (TRI), and “Income Before Special Items” from Compustat, owned by S&P Global (SPGI). Specifically, our earnings data is:
- More accurate (Section 3.2)
- More predictive of future earnings (Section 3.4)
- More predictive of future stock prices (Section 4.3).
More Accurate: We Identify More Non-Core and Unusual Items
The purpose of core earnings is to measure the normalized operating profitability of a business. Accordingly, analysts should strip out any gains/losses that are non-core or unusual.
The problem is that identifying unusual items has become increasingly difficult. Professors from HBS and MIT Sloan show in Core Earnings: New Data & Evidence that our “novel dataset” identifies significantly more unusual items than “Special Items” from Compustat and “Street Adjustments” from IBES. Those services capture just half of the non-core items that we capture. See page 26 of the paper for more details. Here are examples from the paper of unusual items we collect that Compustat misses:
- In 2016, CBS reported $211 million in “Pension settlement charges” on its income statement. Compustat “does not report this pension settlement charge in any of the relevant variables.” See page 14 and 15.
- In 2016, Bluelinx Holdings (BXC) reported $28 million in income from the “gains from sales of property.” Compustat failed to report this gain on sale. See page 37.
- In 2006, ACCO Brands (ACCO) reported a $23 million “restructuring and asset-impairment charge.” Compustat failed to report this charge. See page 37.
More examples of non-core items identified in our models, but missing from Compustat, can be found in Table A.1 on page 37 of the paper.
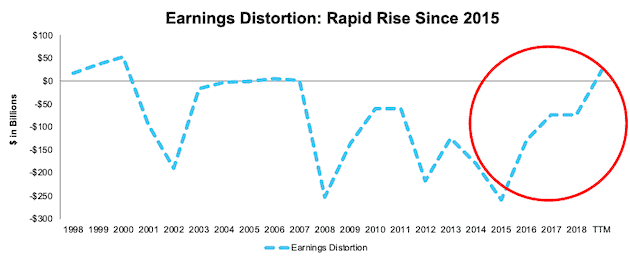
Figure 1 shows that Earnings Distortion, which captures all the non-core items we remove from core earnings, is material, to say the least. The last times Earnings Distortion moved into positive territory, in 2006-2007 and 1998-2000, the market crashed. Investors using traditional data would be none the wiser.
Figure 1: Earnings Distortion is the Highest Since 2000 (Data through November 18, 2019)
Sources: New Constructs, LLC and company filings.
This analysis is based on the top 1,000 companies by market cap in each measurement period.
More Predictive of Future Earnings
Our core earnings predict future earnings better than Compustat and IBES because we strip out more non-core and unusual items. The paper empirically shows that our “Core Earnings is a significantly better forecaster of future Net Income...” See section 3.2 of the paper for more details.
The authors also show that the non-core items we identify produce a measure of core earnings that is “incremental to alternative measures of operating performance in predicting an array of future income measures.” The alternative measures compared in the paper include “Street Earnings”, a proxy for core earnings created by IBES, and Compustat’s[1] “Income Before Special Items.” See section 3.4 of the paper for more details.
More Predictive of Future Stock Prices
In Section 4.3 of the paper, the professors present a long/short strategy that generates 10% in annual returns using our Earnings Distortion metric. The low turnover strategy holds the stocks with the most understated earnings and shorts the stocks with the most overstated earnings.
To further analyze the impact that properly identifying non-core items has on returns, the professors examined total adjustments, a measure based on our data, to alternative proxies for transitory or non-core earnings. Specifically, they compared total adjustments to Compustat’s “special items” and IBES’ “street adjustments” and found that our total adjustments is,
“the only measure of non-core earnings that offers incremental explanatory power for returns.”
More details in Table 9 of the paper.
How to Make Money with This New Research
While the paper outlines a long/short portfolio, we provide two strategies to exploit our “novel dataset” of earnings adjustments:
- Short-term – use our Earnings Distortion Scores to trade stocks most likely to beat or miss earnings estimates. Get started now with our Earnings Distortion Scorecards for the 1Q20 earnings season.
- Long-term strategy – use our Stock Ratings to own more stocks with understated earnings and avoid/sell stocks with overstated earnings. Get our Stock, ETF & Mutual Fund Ratings here.
For more details on how to use core earnings to pick better stocks, click here. Click here for more details on our data offerings.
We Provide 100% Audit-ability & Transparency
Clients can audit all of the unusual items used in our calculations in the Marked-Up Filings section of each of our Company Valuation models. We are 100% transparent about what goes into our research because we want investors to trust our work and see how much goes into building the best earnings quality and valuation models.
This article originally published on January 27, 2020.
Disclosure: David Trainer, Kyle Guske II, and Matt Shuler receive no compensation to write about any specific stock, style, or theme.
Follow us on Twitter, Facebook, LinkedIn, and StockTwits for real-time alerts on all our research.
[1] It’s worth noting that Compustat also provides “S&P Core Earnings”, a variable that adjusts for eight factors to better measure core earnings. However, the authors did not examine this variable because: “(1) transparency is lacking about what is included in the adjustments, (2) the set of adjustments do not reflect the entire population of adjustments, and (3) the variable is available for only one-third of all firm-years in Compustat.”