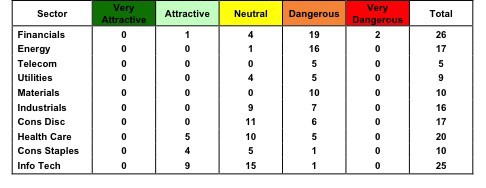
The consumer staples and information technology sectors win the best predictive ratings among the ten major sectors. Both get our “attractive” rating. Our Sector Roadmap report ranks and rates all of the 10 sectors. It also benchmarks all sectors against the S&P 500, which gets our “neutral” rating and the Russell 2000, which gets our “dangerous” rating.
Being the only attractive-rated sectors means that the consumer staples and information technology sectors have the best quality-of-earnings and valuation of all sectors. This means they also have the most market value allocated to stocks with high quality of earnings and cheap valuations.
The financials sectors is the worst-rated sector and is the only sector with ETFs that get a “very dangerous” rating. It also has the most “dangerous-rated” ETFs.
Not surprisingly, the consumer staples and information technology sectors also have the most attractive-rated ETFs and the least dangerous-or-worse-rated ETFs. Figure 1 shows the ratings of the 155 ETFs we cover within each sector. In total, we cover and provide predictive ratings on about 400 US equity ETFs.
Figure 1: Predictive ETF Ratings By Sector

The two sector ETFs with the best investment potential come from the consumer staples sector:
Both of these ETFs benefit from holding “very attractive” stocks: Phillip Morris (PM) and Wal-Mart (WMT).
The top two information technology sector ETFs are:
Both of these ETFs benefit from holding “very attractive” stocks: Apple (AAPL) and Google (GOOG).
The worst-rated ETFs are, not surprisingly, in the financials sector.
Both of these ETFs’ ratings are hurt by holding lots of “very dangerous” stocks, such as JPMorgan Chase (JPM) and Citigroup (C), and “dangerous” stocks, such as US Bancorp (USB) and SunTrsut Banks (STI).
As detailed in our reports on the “Best & Worst ETFs” for each sector, there are alarming differences in the number of holdings and sizes of allocations to stocks by ETFs within the same sector.
Investors must analyze all of the holdings of an ETF or mutual fund to ensure they are making smart investment decisions.
Traditional fund research pays little attention to the quality (or lack thereof) of the holdings of a fund. So, investors need to beware of the fact that traditional fund rating systems are not predictive or intended to be predictive despite the common perception otherwise.
Our ratings on funds and sectors are predictive and are just like our stock ratings. We measure the quality of earnings and valuation of funds and sectors by aggregating our models for all the stocks within each fund and sector. We weight the results of the models according to market value for sector; for funds we weight results of models according to the funds’ allocations to each holding.
Disclosure: I have a position in WMT, PM, AAPL and GOOG. I receive no compensation to write about any specific stock, sector or theme.
