
This report shows how well Materials ETFs and mutual fund managers pick stocks. We juxtapose our Portfolio Management Rating on funds, which grades managers based on the quality of the stocks they choose, with the number of good stocks available in the sector. This analysis shows whether or not ETF providers and mutual fund managers deserve their fees.
For example, if a fund has a poor Portfolio Management Rating in a sector where there are lots of good stocks, that fund does not deserve the fees it charges, and investors are much better off putting money in a passively-managed fund or investing directly in the sector’s good stocks. On the other hand, if a fund has a good Portfolio Management Rating in a sector where there are lots of bad stocks, then investors should put money in that fund, assuming the fund’s costs are competitive.
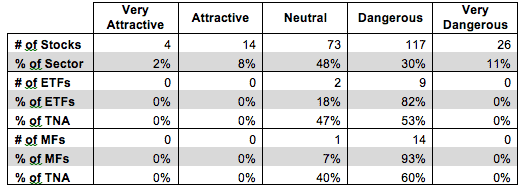
Figure 1 shows how many good stocks, according to our nationally-recognized ratings, are in the sector and their market cap. Next, it juxtaposes the Portfolio Management Ratings of the ETFs and mutual funds in the sector. We think investors can gain an advantage with our forward-looking fund ratings since past performance is not a reliable predictor of future returns.
Figure 1 shows that 18 out of the 234 stocks (only 10% of the market value) in Materials ETFs and mutual funds get an Attractive-or-better Portfolio Management Rating.
The main takeaway from Figure 1 is that with so few quality stocks, it is not surprising to see few ETF providers and mutual fund managers earning Attractive-or-better Portfolio Management ratings. Investors in the Materials sector would be better off buying individual stocks.
Zero out 11 ETFs allocate enough to quality stocks to earn an Attractive-or-better Portfolio Management Rating. Mutual fund managers have not fared much better as zero out of 15 mutual funds allocate enough of their assets to quality stocks to earn an Attractive-or better Portfolio Management Rating. ETF providers and mutual fund managers need to do a better job to justify their fees.
With so few quality Materials ETFs available to investors, 53% of investor assets in Materials ETFs are invested in ETFs with Dangerous-or-worse Portfolio Management Ratings. The picture is worse for mutual fund investors as over 60% of investor assets in the sector are allocated to mutual funds with Dangerous-or-worse Portfolio Management Ratings.
As mentioned above, investors are disproportionately allocated to the worst ETFs and mutual funds in the Materials sector. We think investors would fare better if they allocated more capital to better-rated funds.
Figure 1: Materials Sector: Comparing Quality of Stock Picking to Quality of Stocks Available
Sources: New Constructs, LLC and company filings
Guggenheim S&P Equal Weight Materials ETF (RTM) has the highest Portfolio Management Rating of all Materials ETFs and earns my Neutral Portfolio Management Rating. Fidelity Chemicals Portfolio (FSCHX) has the highest Portfolio Management Rating of all Materials mutual funds and earns my Neutral Portfolio Management Rating.
State Street SPDR S&P Metals and Mining ETF (XME) has the lowest Portfolio Management Rating of all Materials ETFs and earns my Dangerous Portfolio Management Rating. Vanguard Materials Index Fund (VMIAX) has the lowest Portfolio Management Rating of all Materials mutual funds and earns my Dangerous Portfolio Management Rating.
Crown Holdings (CCK) is one of my favorite holdings of Materials ETFs and mutual funds and earns my Attractive rating. Over the past decade, Crown has grown after-tax profits (NOPAT) by 13% compounded annually. Crown earned a return on invested capital (ROIC) of 8% in 2013, well above the 5% average of all Materials companies I cover. The company has also generated positive economic earnings for six consecutive years. Despite strong profit growth, CCK’s stock is a real bargain. At its current price of ~$43/share, CCK has a price to economic book value (PEBV) ratio of 1.0. This ratio implies the market expects Crown Holdings to never meaningfully grow NOPAT for the remaining life of the company. This expectation seems rather pessimistic given Crown’s past decade of profit growth.
Consol Energy (CNX) is one of my least favorite holdings of XME and earns my Very Dangerous rating. Since 2010, Consol Energy’s NOPAT has declined by 27% compounded annually. The company’s ROIC has followed a similar path and fell from 8% in 2009 to under 3% in 2013. Consol has also earned positive economic earnings just once since 2000. Investors have begun to take notice and CNX’s stock price has fallen 20% over the last six months. However, Consol Energy remains overvalued and looks likely to decline even further. To justify its current price of ~$32/share CNX would need to grow NOPAT by 12% compounded annually for the next 17 years. CNX has shown no signs of NOPAT growth as of late, and the market’s priced-in expectation of nearly two decades of double digit NOPAT growth is unrealistic.
Many ETF providers and mutual fund managers do a poor job identifying quality stocks. Their funds allocate heavily to overvalued stocks like Consol Energy and don’t hold high quality stocks such as Crown Holdings. These funds are not worth owning at any cost.
The emphasis that traditional research places on low costs is a positive for investors, but low fees alone do not drive performance. Only good holdings can. Don’t fall prey to the index label myths. Even “passive” investors should be analyzing the holdings of their funds.
Our Best & Worst ETFs and Mutual Funds for the Materials Sector report reveals our predictive ratings on the best and worst funds in the sector.
Kyle Guske II contributed to this report.
Disclosure: David Trainer and Kyle Guske II receive no compensation to write about any specific stock, sector, or theme.