The post-election rally has taken a breather this week as earnings season winds down. As the dust settles, investors are looking for opportunity amidst a new landscape. Often, some of the best opportunities come not from the latest hype stock or momentum play, but from bellwethers that have a proven track record to generate profits throughout all economic cycles. After all, many investors are likely exhausted by the hype and election mania. It’s time to get back to getting real work done, not just making promises.
For example, it’s good to see President-elect Trump create the Department of Government Efficiency, but who knows if that department will ever get anything done. It’s possible all it accomplishes is a bunch of saber rattling with no real impact on the government or our economy.
When it comes to this week’s Long Idea, we can say that this company gets real work done. It is a critical contributor to our economy.
As the market sits near record highs and many stocks look significantly overvalued, this week’s Long Idea remains undervalued. Despite record profits, a leading market share, the company’s stock price still trades as if profits will never grow again.
Our process for picking stocks is about as rigorous as it gets, and we’re proud to show our work. We’re not giving you the ticker for this pick, but we are happy to share large excerpts from the report.
We leverage our proven-superior fundamental data to identify the good companies – those that generate lasting profits and create real shareholder value – that are also good stocks. Only by understanding the true cash flows of a business can investors know if a company’s stock price is attractive or unattractive.
The information below comes from the recent update on our thesis for this stock, available to Pro and Institutional members. And, you can buy the full report a la carte here.
This stock presents quality Risk/Reward based on the company’s:
- strong revenue and profit growth
- leading, and rising, capital ratios
- strong cash flows and shareholder yield,
- leading profitability, and
- cheap stock valuation.
What’s Working
Record Profits
In 3Q24, this company beat both top and bottom-line expectations, which was the seventh top and bottom-line beat in the past eight quarters.
The strength of the company was exhibited across all sides of the business in the most recent quarter. Total net revenue was up 7% year-over-year (YoY). Noninterest revenue was up 12% YoY, and net interest income was up 3% YoY in 3Q24. Through the first nine months of 2024, noninterest revenue is up 21% YoY, and net interest income is up 6% YoY.
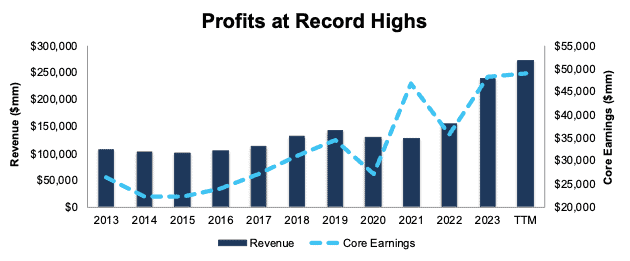
Long-term, the company has grown revenue and Core Earnings by 9% and 6% compounded annually, respectively, since 2013. See Figure 1. The company’s net operating profit after-tax (NOPAT) margin fell slightly, from 20.5% in 2013 to 19.2% in the TTM ended 3Q24, while invested capital turns increased from 0.4 to 0.7 over the same time. Rising IC turns more than offset the decline in NOPAT margin and drive the company’s return on invested capital (ROIC) from 9% in 2013 to 14% in the TTM.
Perhaps most impressive, this company has never generated negative Core Earnings in the history of our model, which dates to 1998.
Figure 1: Revenue and Core Earnings: 2013 – TTM ended 3Q24
Sources: New Constructs, LLC and company filings
Showcasing Strength Through Safety
Largely, banks are better capitalized and on better financial footing than in recent years, but this one continues to stand above the rest.
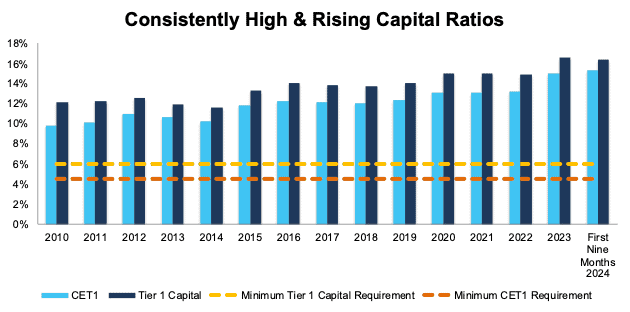
At the end of 3Q24, the company’s Common Equity Tier I Capital Ratio (CET1), the equity portion of its Tier I Capital, was 15.3%, which is up from 15.0% at the of 2023 and 13.2% at the end of 2022.
Additionally, the company’s Tier 1 Capital ratio, which measures a bank’s core equity capital to its total risk-weighted assets is 16.4% through the first nine months of 2024, which is up from 15.9% in the first nine months of 2023. Best of all, these ratios have been trending higher for over a decade. See Figure 2.
Figure 2: Tier I Capital and Common Equity Tier 1 Capital Ratios: 2010-3Q24
Source: New Constructs, LLC and company filings
….there’s much more in the full report. You can buy the report a la carte here.
Or, become a Professional or Institutional member – they get all Long Idea reports.


