At the beginning of the first quarter of 2017, only the Large Cap Blend and All Cap Blend styles earn an Attractive-or-better rating. Our style ratings are based on the aggregation of our fund ratings for every ETF and mutual fund in each style. See last quarter’s Style Ratings here.
Investors looking for style funds that hold quality stocks should look no further than the Large Cap Blend and All Cap Blend styles. These styles house the highest rated funds. Figures 4 through 7 provide more details. The primary driver behind an Attractive fund rating is good portfolio management, or good stock picking, with low total annual costs.
Attractive-or-better ratings do not always correlate with Attractive-or-better total annual costs. This fact underscores that (1) cheap funds can dupe investors and (2) investors should invest only in funds with good stocks and low fees.
See Figures 4 through 13 for a detailed breakdown of ratings distributions by investment style. See our ETF & mutual fund screener for rankings, ratings and reports on 7000+ mutual funds and 400+ ETFs. Our fund rating methodology is detailed here.
All of our reports on the best & worst ETFs and mutual funds in every investment style are available here.
Figure 1: Ratings For All Investment Styles
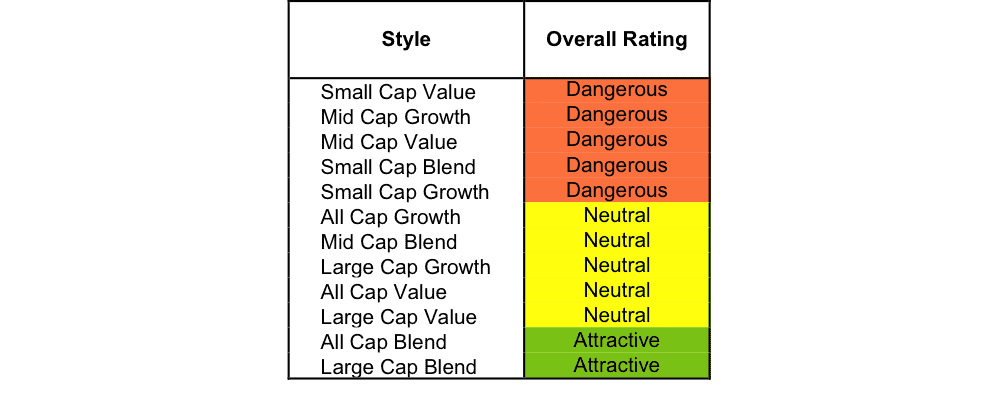
Source: New Constructs, LLC and company filings
To earn an Attractive-or-better Predictive Rating, an ETF or mutual fund must have high-quality holdings and low costs. Only the top 30% of all ETFs and mutual funds earn our Attractive or better rating.
AB Core Opportunities Fund (ADGRX) is the top rated Large Cap Blend fund. It gets our Very Attractive rating by allocating over 24% of its value to Attractive-or-better-rated stocks.
Bridgeway Omni Small-Cap Value Fund (BOSVX) is the worst rated Small Cap Value fund. It gets our Very Dangerous rating by allocating over 36% of its value to Dangerous-or-worse-rated stocks. Making matters worse, it charges investors total annual costs of 0.9%.
Figure 2 shows the distribution of our Predictive Ratings for all investment style ETFs and mutual funds.
Figure 2: Distribution of ETFs & Mutual Funds (Assets and Count) by Predictive Rating
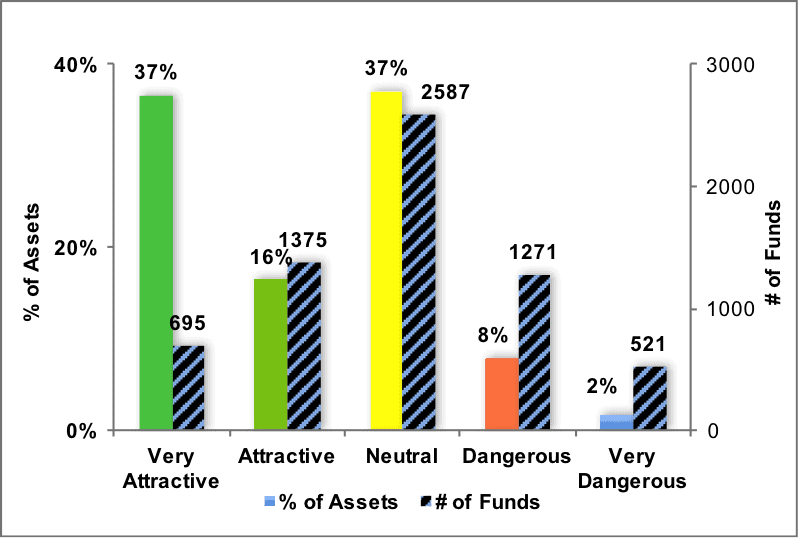
Source: New Constructs, LLC and company filings
Figure 3 offers additional details on the quality of the investment style funds. Note that the average total annual cost of Very Dangerous funds is almost 15 times that of Very Attractive funds.
Figure 3: Predictive Rating Distribution Stats
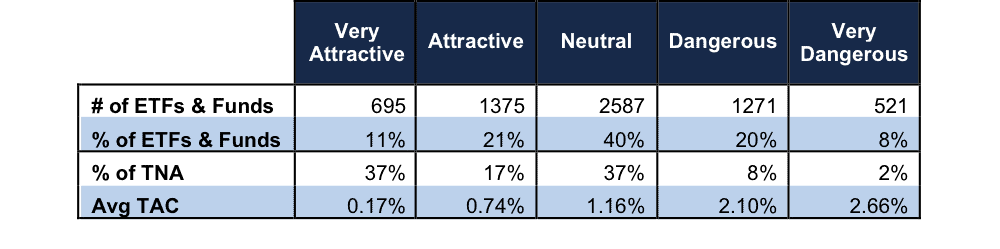
* Avg TAC = Weighted Average Total Annual Costs
Source: New Constructs, LLC and company filings
This table shows that only the best of the best funds get our Very Attractive Rating: they must hold good stocks AND have low costs. Investors deserve to have the best of both and we are here to give it to them.
Ratings by Investment Style
Figure 4 presents a mapping of Very Attractive funds by investment style. The chart shows the number of Very Attractive funds in each investment style and the percentage of assets in each style allocated to funds that are rated Very Attractive.
Figure 4: Very Attractive ETFs & Mutual Funds by Investment Style
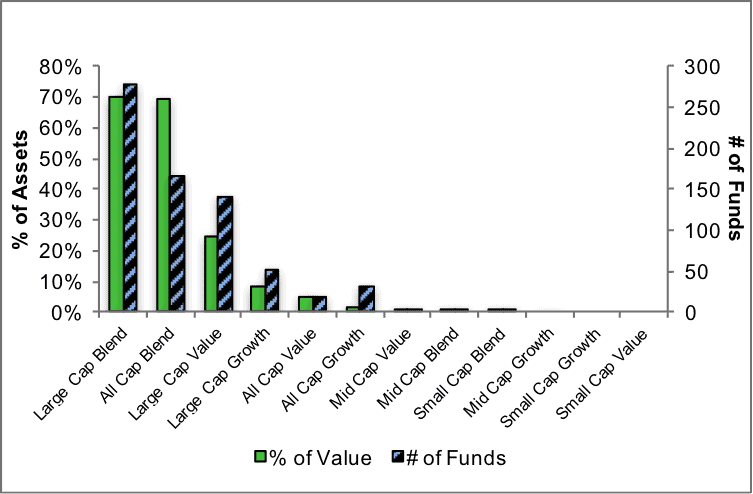
Source: New Constructs, LLC and company filings
Figure 5 presents the data charted in Figure 4.
Figure 5: Very Attractive ETFs & Mutual Funds by Investment Style
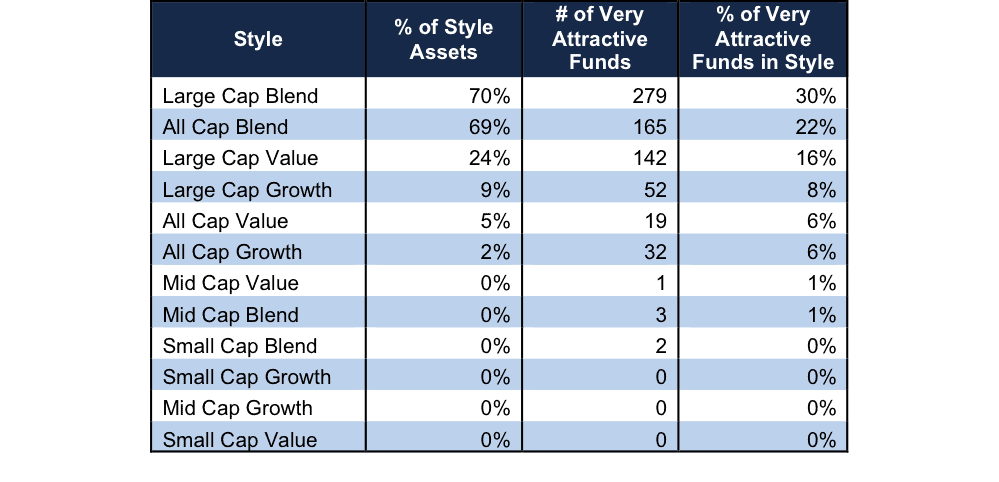
Source: New Constructs, LLC and company filings
Figure 6 presents a mapping of Attractive funds by investment style. The chart shows the number of Attractive funds in each style and the percentage of assets allocated to Attractive-rated funds in each style.
Figure 6: Attractive ETFs & Mutual Funds by Investment Style
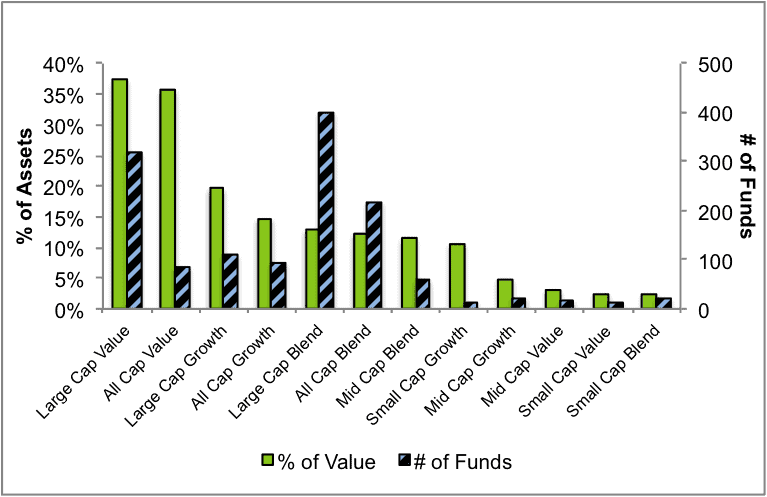
Source: New Constructs, LLC and company filings
Figure 7 presents the data charted in Figure 6.
Figure 7: Attractive ETFs & Mutual Funds by Investment Style
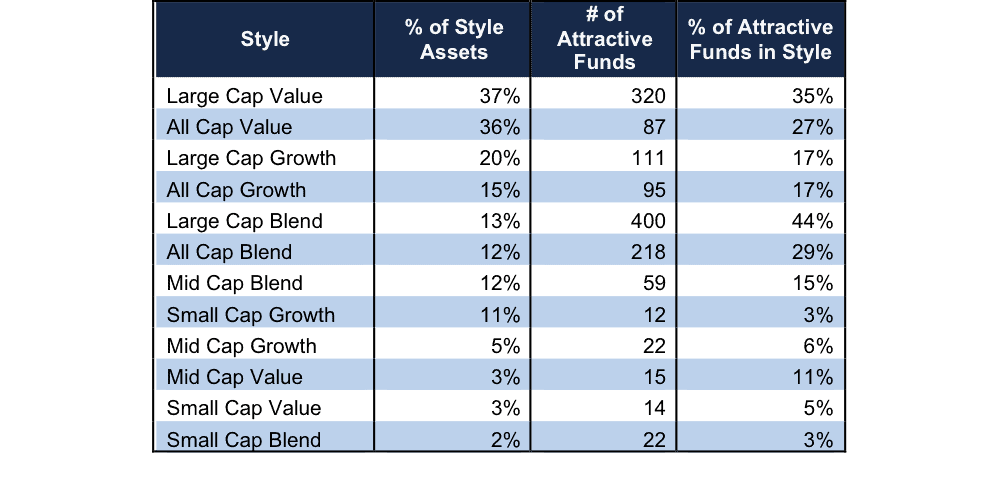
Source: New Constructs, LLC and company filings
Figure 8 presents a mapping of Neutral funds by investment style. The chart shows the number of Neutral funds in each investment style and the percentage of assets allocated to Neutral-rated funds in each style.
Figure 8: Neutral ETFs & Mutual Funds by Investment Style
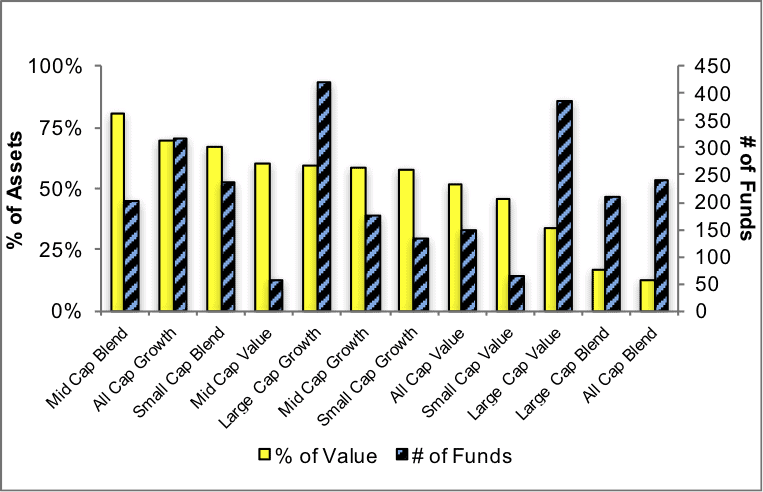
Source: New Constructs, LLC and company filings
Figure 9 presents the data charted in Figure 8.
Figure 9: Neutral ETFs & Mutual Funds by Investment Style
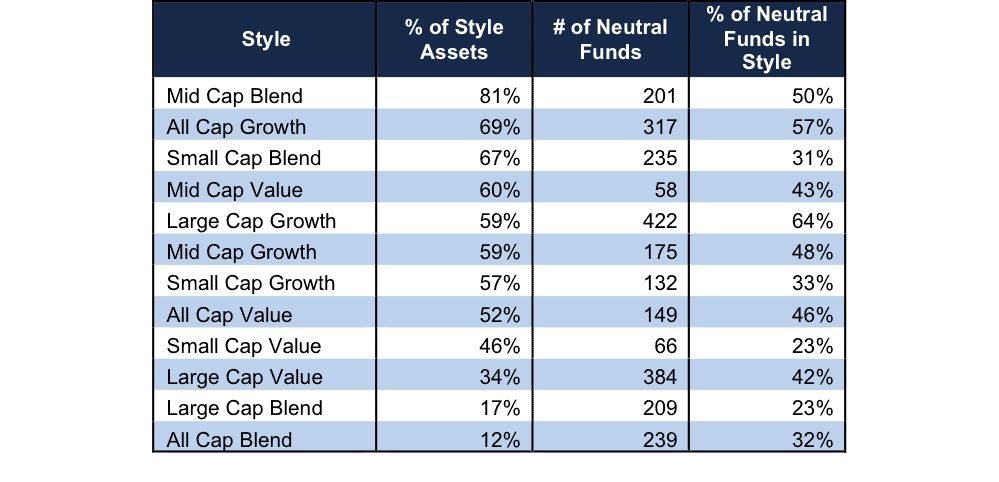
Source: New Constructs, LLC and company filings
Figure 10 presents a mapping of Dangerous funds by fund style. The chart shows the number of Dangerous funds in each investment style and the percentage of assets allocated to Dangerous-rated funds in each style.
The landscape of style ETFs and mutual funds is littered with Dangerous funds. Investors in Small Cap Value have put over 43% of their assets in Dangerous-rated funds.
Figure 10: Dangerous ETFs & Mutual Funds by Investment Style
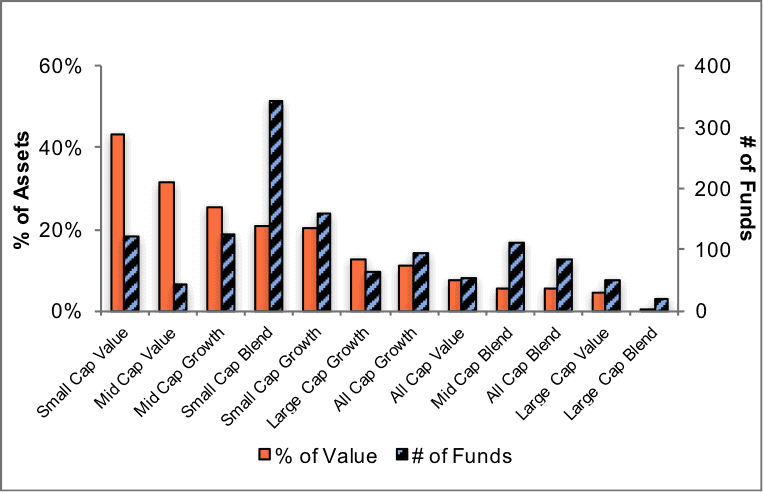
Source: New Constructs, LLC and company filings
Figure 11 presents the data charted in Figure 10.
Figure 11: Dangerous ETFs & Mutual Funds by Investment Style
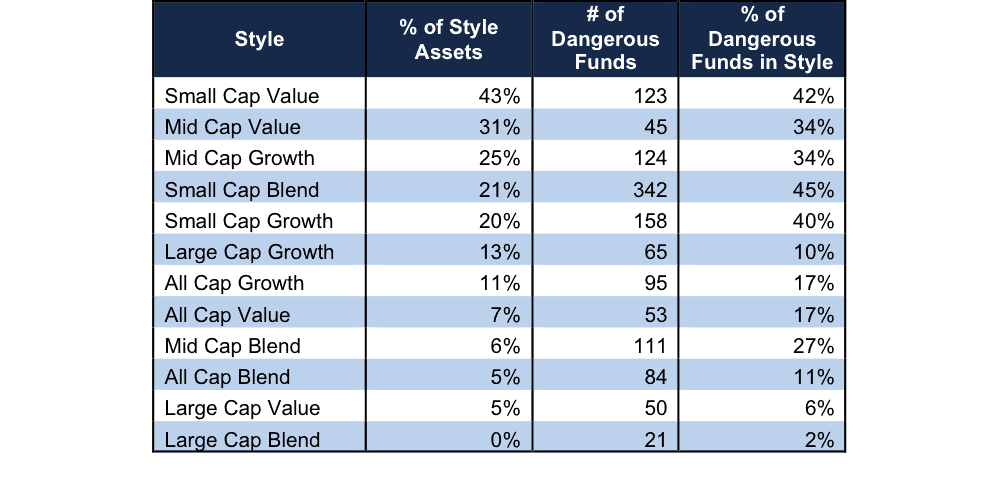
Source: New Constructs, LLC and company filings
Figure 12 presents a mapping of Very Dangerous funds by fund style. The chart shows the number of Very Dangerous funds in each investment style and the percentage of assets in each style allocated to funds that are rated Very Dangerous.
Figure 12: Very Dangerous ETFs & Mutual Funds by Investment Style
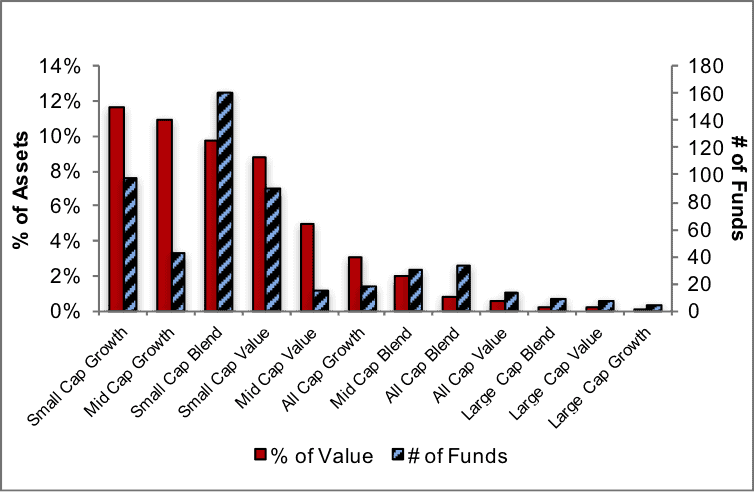
Source: New Constructs, LLC and company filings
Figure 13 presents the data charted in Figure 12.
Figure 13: Very Dangerous ETFs & Mutual Funds by Investment Style
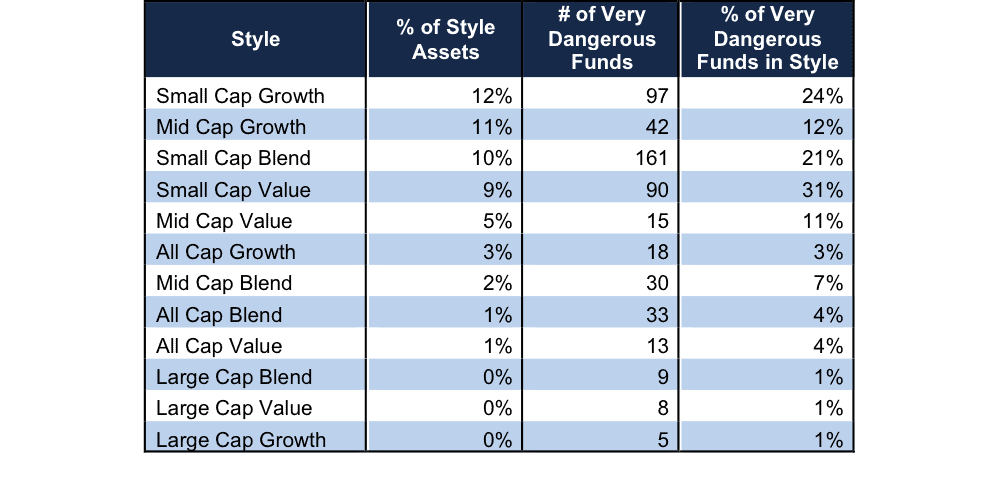
Source: New Constructs, LLC and company filings
This article originally published here on January 26, 2017.
Disclosure: David Trainer, Kyle Guske and Kyle Martone receive no compensation to write about any specific stock, sector or theme.
Scottrade clients get a Free Gold Membership ($588/yr value) as well as 50% discounts and up to 20 free trades ($140 value) for signing up to Platinum, Pro or Unlimited memberships. Login or open your Scottrade account & find us under Quotes & Research/Investor Tools.