
As the first quarter of 2022 opens, the All Cap Value, All Cap Blend, and Large Cap Blend fund styles earn Attractive-or-better ratings. Our style ratings are based on the normalized aggregation of our fund ratings for every ETF and mutual fund in each style. Our fund ratings are based on aggregations of the ratings of the stocks they hold. See last quarter’s Style Ratings here.
The primary driver behind an Attractive fund rating is good portfolio management, or good stock picking and low total annual costs. However, Attractive-or-better total annual costs are by no means an automatic qualification for an Attractive-or-better fund rating. This fact underscores that (1) cheap funds can dupe investors and (2) investors should invest only in funds with good stocks and low fees.
More reliable and proprietary fundamental data, proven in The Journal of Financial Economics, drives our research. Our Robo-Analyst technology[1] empowers our unique ETF and mutual fund rating methodology, which leverages our rigorous analysis of each fund’s holdings.[2] Our Core Earnings[3] and Earnings Distortion factor general novel alpha.
See Figures 4 through 13 for a detailed breakdown of ratings distributions by investment style. See our ETF & mutual fund screener for rankings, ratings, and reports on 6,600+ mutual funds and 900+ ETFs. Our fund rating methodology is detailed here.
All our reports on the best & worst ETFs and mutual funds in every investment style are available here.
Figure 1: Ratings for All Investment Styles
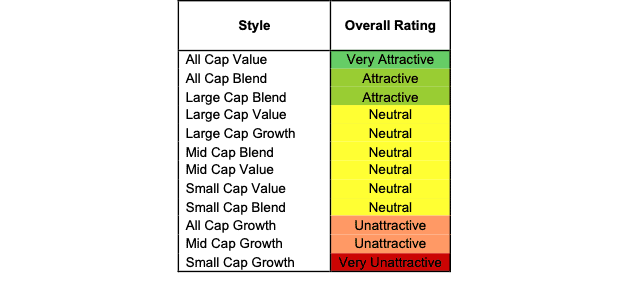
Source: New Constructs, LLC and company filings
To earn an Attractive-or-better Predictive Rating, an ETF or mutual fund must have high-quality holdings and low costs. Only the top 30% of all ETFs and mutual funds earn our Attractive-or-better rating.
Deutsche DWS CROCI Equity Dividend Fund (KDHTX) is the top rated All Cap Value fund. It gets our Very Attractive rating by allocating over 75% of its value to Attractive-or-better-rated stocks.
Optimum Small Mid Cap Growth Fund (OASGX) is the worst rated Small Cap Growth fund. It gets our Very Unattractive rating by allocating over 50% of its value to Unattractive-or-worse-rated stocks. Making matters worse, it charges investors total annual costs of 4.55%.
Figure 2 shows the distribution of our Predictive Ratings for all investment style ETFs and mutual funds.
Figure 2: Distribution of ETFs & Mutual Funds (Assets and Count) by Predictive Rating
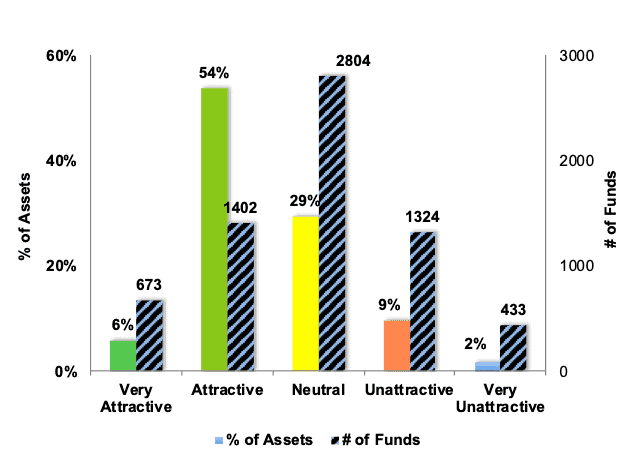
Source: New Constructs, LLC and company filings
Figure 3 offers additional details on the quality of the investment style funds. Note that the average total annual cost of Very Unattractive funds is almost five times that of Very Attractive funds.
Figure 3: Predictive Rating Distribution Stats
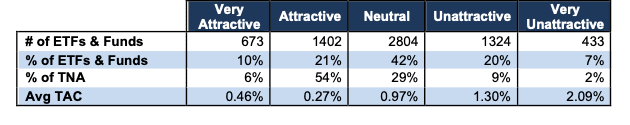
* Avg TAC = Weighted Average Total Annual Cost
Source: New Constructs, LLC and company filings
Ratings by Investment Style
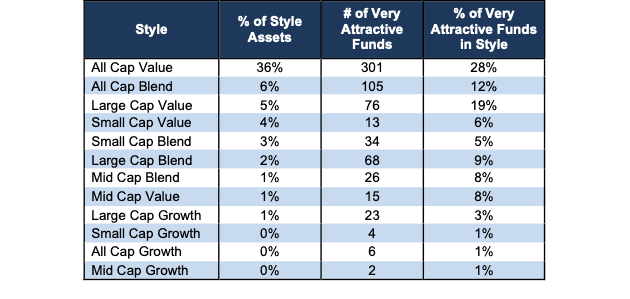
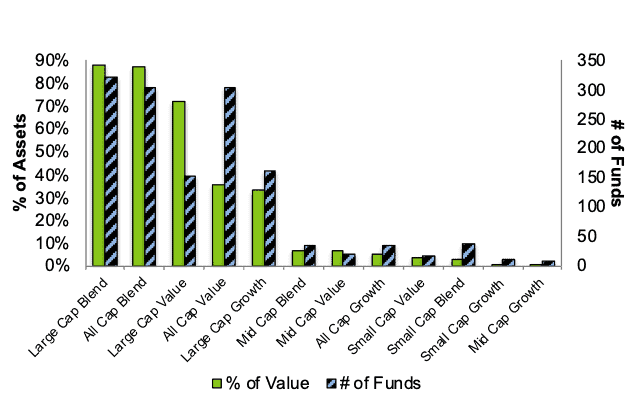
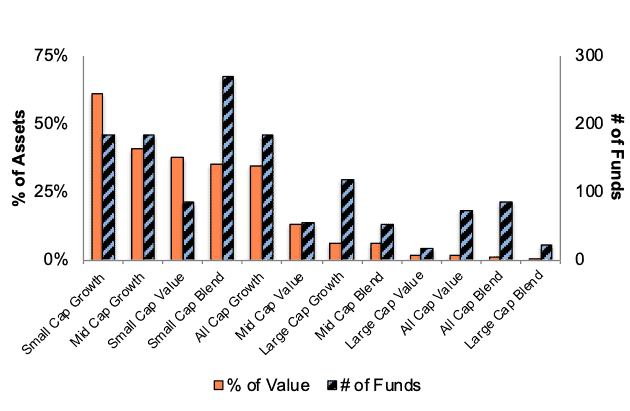
Figure 4 presents a mapping of Very Attractive funds by investment style. The chart shows the number of Very Attractive funds in each style and the percentage of assets allocated to Very Attractive-rated funds.
Figure 4: Very Attractive ETFs & Mutual Funds by Investment Style
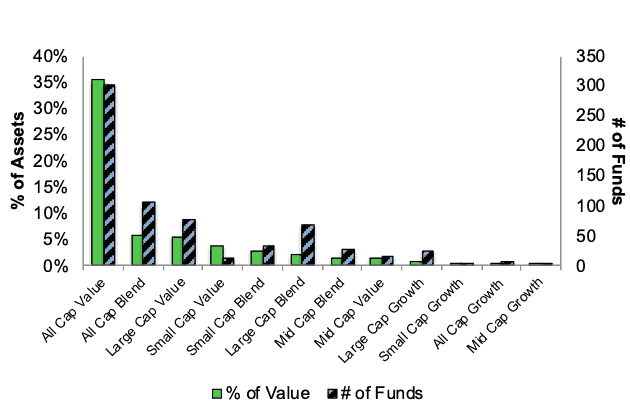
Source: New Constructs, LLC and company filings
Figure 5 presents the data charted in Figure 4.
Figure 5: Very Attractive ETFs & Mutual Funds by Investment Style
Source: New Constructs, LLC and company filings
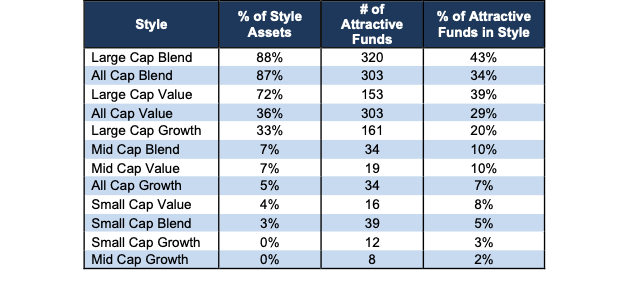
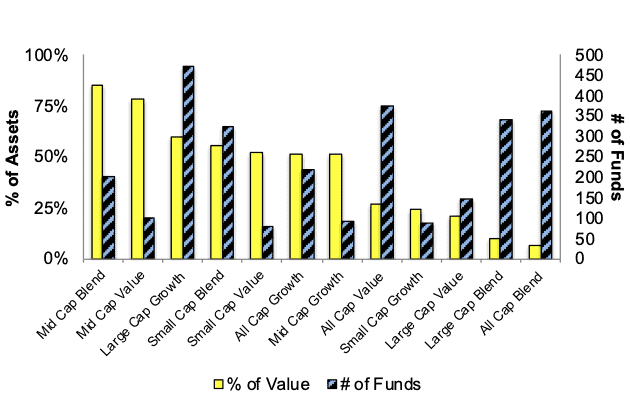
Figure 6 presents a mapping of Attractive funds by investment style. The chart shows the number of Attractive funds in each style and the percentage of assets allocated to Attractive-rated funds.
Figure 6: Attractive ETFs & Mutual Funds by Investment Style
Source: New Constructs, LLC and company filings
Figure 7 presents the data charted in Figure 6.
Figure 7: Attractive ETFs & Mutual Funds by Investment Style
Source: New Constructs, LLC and company filings
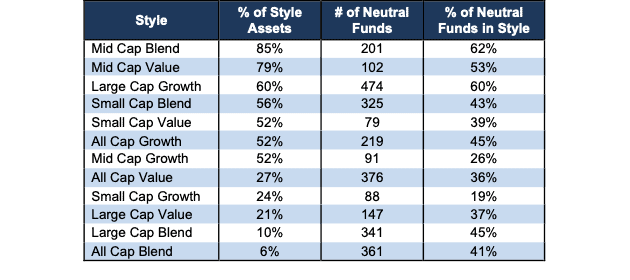
Figure 8 presents a mapping of Neutral funds by investment style. The chart shows the number of Neutral funds in each style and the percentage of assets allocated to Neutral-rated funds.
Figure 8: Neutral ETFs & Mutual Funds by Investment Style
Source: New Constructs, LLC and company filings
Figure 9 presents the data charted in Figure 8.
Figure 9: Neutral ETFs & Mutual Funds by Investment Style
Source: New Constructs, LLC and company filings
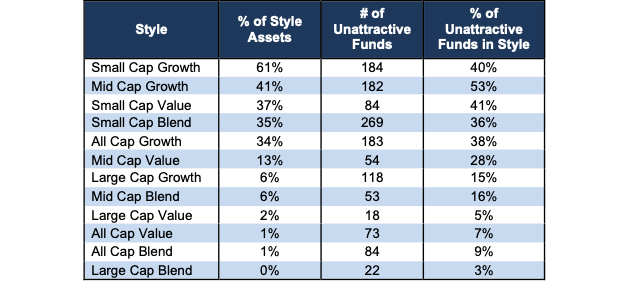
Figure 10 presents a mapping of Unattractive funds by investment style. The chart shows the number of Unattractive funds in each style and the percentage of assets allocated to Unattractive-rated funds.
The landscape of style ETFs and mutual funds is littered with Unattractive funds. Investors in Small Cap Growth have put over 61% of their assets in Unattractive-rated funds.
Figure 10: Unattractive ETFs & Mutual Funds by Investment Style
Source: New Constructs, LLC and company filings
Figure 11 presents the data charted in Figure 10.
Figure 11: Unattractive ETFs & Mutual Funds by Investment Style
Source: New Constructs, LLC and company filings
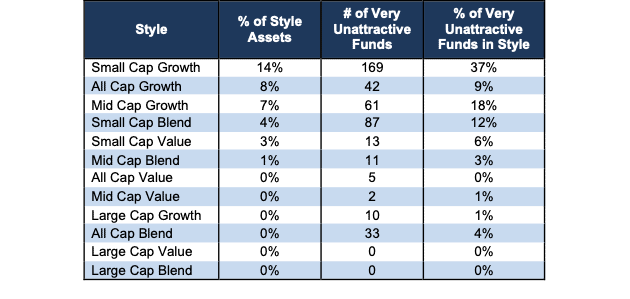
Figure 12 presents a mapping of Very Unattractive funds by investment style. The chart shows the number of Very Unattractive funds in each style and the percentage of assets allocated to Very Unattractive-rated funds.
Figure 12: Very Unattractive ETFs & Mutual Funds by Investment Style
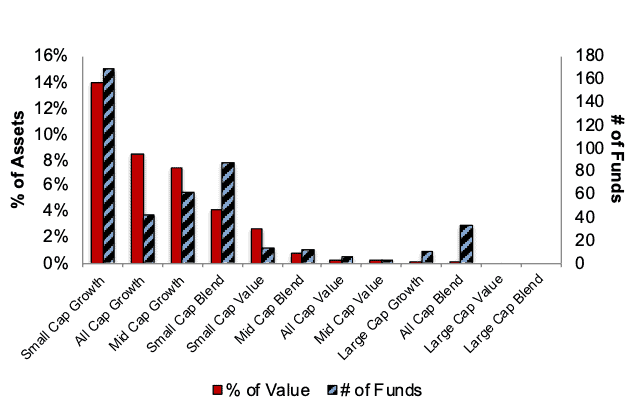
Source: New Constructs, LLC and company filings
Figure 13 presents the data charted in Figure 12.
Figure 13: Very Unattractive ETFs & Mutual Funds by Investment Style
Source: New Constructs, LLC and company filings
This article originally published on January 19, 2022.
Disclosure: David Trainer, Kyle Guske II, and Matt Shuler receive no compensation to write about any specific stock, sector or theme.
Follow us on Twitter, Facebook, LinkedIn, and StockTwits for real-time alerts on all our research.
[1] Harvard Business School features our research automation technology in the case Disrupting Fundamental Analysis with Robo-Analysts.
[2] See how our models overcome flaws in Bloomberg and Capital IQ’s (SPGI) analytics in the detailed appendix of this paper.
[3] The Journal of Financial Economics proves that only Core Earnings enable investors to overcome the flaws in legacy fundamental data.