ProShares Ultra Semiconductors (USD) is our top pick among the 25 ETFs we analyzed for our 3Q11 update on the “Best & Worst Tech Sector ETFs”.
The tech sector is one of only two sectors to earn our “attractive” rating. For our predictive ratings on all ten sectors, see our 3Q11 Sector Roadmap report. Last quarter, the tech sector got a “neutral” rating. As valuations declined and the economics of tech companies continue to stay strong, the investment merit of companies in the sector improved and enabled the sector to improve its risk/reward rating to “attractive”.
But do not be fooled by an attractive rating. It does not mean that every tech sector ETF is worth buying. In fact, quite the opposite is true. Only nine out of the 25 tech sector ETFs get our attractive rating and are worth buying. 15 tech sector ETFs get our “neutral” rating, which means they offer about the same risk/reward potential as the S&P 500 but with less diversification. And one tech sector ETF, PowerShares Dynamic Networking (PXQ), gets our “dangerous” rating, which means you should sell or short it.
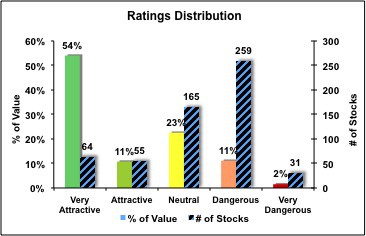
The attractive-rated ETFs earn their rating by allocating to attractive-or-better-rated stocks such as Apple (AAPL), Google (GOOG), Intel (INTC) and SanDisk (SNDK). Figure 1 shows how the information technology sector’s stocks and the market value attributed to them stack up under the microscope of our predictive risk/reward rating system.
Figure 1: Technology Sector – Allocation & Holdings by Predictive Rating

The IT sector has only 13% of its value invested in dangerous-or-worse-rated stocks and 65% of its value invested in attractive-or-better-rated stocks. Though the tech sector is heavily weighted toward attractive-or-better stocks, there are still plenty of dangerous-or-worse-rated stocks that investors should be careful to avoid.
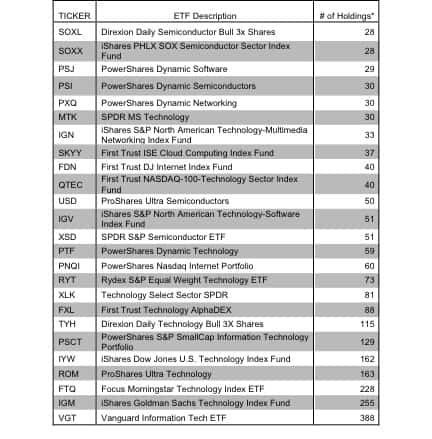
Figure 2: Holdings Count of Technology Sector ETFs
Sources: New Constructs, LLC
Figure 2 shows clearly that tech sector ETFs are not all made the same. Different ETFs have meaningfully different numbers of holdings and, therefore, different allocations to holdings. Given the differences in holdings and allocations, these ETFs will likely perform quite differently.
Consequently, it is important to derive a predictive rating for ETFs based on analysis of the underlying quality of earnings and valuation of the stocks in each ETF.
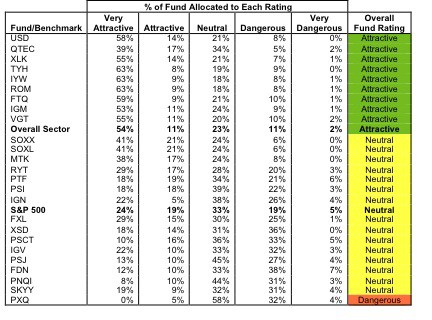
Figure 3 shows how the 25 tech sector ETFs stack up versus each other, the overall sector and the S&P 500 based on their risk/reward ratings and the allocation of their holdings by rating.
Figure 3: Investment Merit Based on Holdings and Allocations

Attractive ETFs:
USD, QTEC, XLK, TYH, IYW, ROM, FTQ, IGM, VGT – these 9 ETFs earn an Attractive-or-better Overall Risk/Reward Rating and therefore, they are the only U.S. Equity Technology ETFs we recommend. Our top pick from this group is USD.
Neutral ETFs:
SOXX, SOXL, MTK, RYT, PTF, PSI, IGN, FXL, XSD, PSCT, IGV, PSJ, FDN, PNQI, and SKYY allocate their value in a way that earns them a Neutral Overall Risk/Reward Rating. We recommend investors buy the Very Attractive and Attractive stocks in this sector before buying any of the U.S. Equity Technology ETFs except those we recommend. Contact me for the full list of the 119 Technology stocks that earn an Attractive-or-better Overall Risk/Reward Rating.
Dangerous ETFs:
We recommend investors avoid PXQ because of its Dangerous Overall Risk/Reward Rating.
Methodology
Our analysis is based on aggregating results from our models on each of the companies included in every ETF and the overall sector (574 companies) based on data as of July 12, 2011[1]. We aggregate results for the ETFs in the same way the ETFs are designed.
Our goal is to empower investors to analyze ETFs in the same way they analyze individual stocks.
Given the success of our rating system for individual stocks, we believe its application to groups of stocks (i.e. ETFs and funds) helps investors make more informed ETF and mutual fund buying decisions. Barron’s featured our uniquely predictive ETF research in “The Danger Within”.
Disclosure: I have a position in INTC, SNDK, AAPL and GOOG. I receive no compensation to write about any specific stock, sector or theme.
[1] For an explanation of the merits of using market-weighted averages in aggregation analysis instead of aggregate values, see Jeremy Siegel’s WSJ article “The S&P Gets Its Earnings Wrong.”

