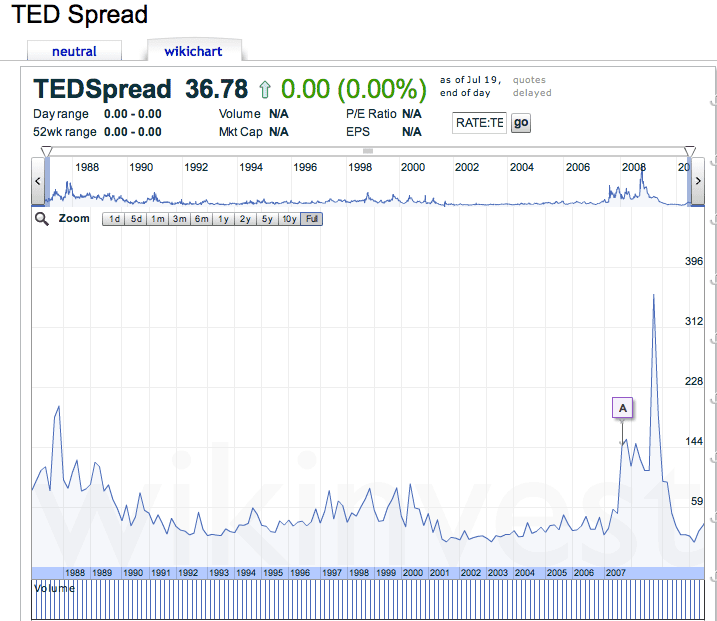
As defined below, the TED Spread is a very common and well-used measure of risk in our financial system. As the chart shows below: “During 2007, the subprime mortgage crisis ballooned the TED spread to a region of 150-200 bps. On September 17, 2008, the TED spread exceeded 300 bps, breaking the previous record set after the Black Monday crash of 1987. Some higher readings for the spread were due to inability to obtain accurate LIBOR rates in the absence of a liquid unsecured lending market. On October 10, 2008, the TED spread reached another new high of 465 basis points.”(wikiPedia)
The takeaway: the TED Spread indicates the financial system is relatively safe these days with no imminent danger. It has recently fallen from recent highs related to the debt issues in Europe and it is no where near where it was during the sub-prime crisis which led to the Lehman crisis when the TED Spread hit historic highs.
Definition and Explanation from Investopedia:
The TED Spread is the price difference between three-month futures contracts for U.S. Treasuries and three-month contracts for Eurodollars having identical expiration months. The Ted spread can be used as an indicator of credit risk. This is because U.S. T-bills are considered risk free while the rate associated with the Eurodollar futures is thought to reflect the credit ratings of corporate borrowers. As the Ted spread increases, default risk is considered to be increasing, and investors will have a preference for safe investments. As the spread decreases, the default risk is considered to be decreasing.
Ted Spread Chart: embedded from wikipedia

