
Dan O’Connor, TechCXO Partner – Guest Contributor
David Trainer, CEO New Constructs
This article originally published here on January 30, 2017.
Executive Summary
Working capital optimization initiatives have not been a high priority for senior executives once the Financial Crisis of 2008 ended. Historically low interest rates have allowed enterprises to borrow their way out of any potential cash bottlenecks. When credit is cheap and plentiful, why should companies care about generating cash from working capital?
For one thing, any money unnecessarily tied up in inventory, receivables, and payables is money that can be used to self-fund strategic initiatives such as R&D or acquisitions. Low interest rates will not last forever, and executives need to focus on funding sources other than debt. Working capital represents a significant portion of most companies invested capital base (working capital, PP&E, Goodwill and other intangibles). Organizations that focus on capital efficiency performance realize the following benefits:
- Reduce reliance on external debt/equity capital
- Increase cash flow
- Reduce operational and financial risks
- Reduce stock price volatility and cost of capital
- Higher enterprise valuations from the investment community
Leveraging data and analytics provided by New Constructs, we calculated working capital metrics for each company included in the Russell 3000 Index as of November 30, 2016. Previously, conducting such an analysis was infeasible due to technology limitations and scalability challenges. From this analysis, we show that working capital metrics fluctuate significantly within sectors, especially between the top quartile companies vs. the bottom quartile companies. Across sectors, differences in working capital metrics can be more than 50 days.
Based on our analysis, we estimate that Russell 3000 companies can free up between $600 billion to $1 trillion by focusing on working capital optimization initiatives.
We conclude with a “Call to Action” for senior executives to take a holistic view of their organization and concentrate on the following working capital initiatives to drive sustainable shareholder value creation:
- Assessment of Working Capital Processes
- Define Desired Outcomes
- Formulate Solutions
- Align Stakeholder Expectations
The Analysis
We conducted an analysis – as of November 30, 2016 – of companies included in the Russell 3000 to calculate working capital metrics and identify the top sectors for working capital efficiency. For purposes of this analysis, working capital metrics are calculated as follows:
- Days Sales Outstanding (DSO): 365 Days Divided by Accounts Receivable Turnover or
365 / (Revenue/Ending Accounts Receivable)
- Days Inventory Outstanding (DIO): 365 Days Divided by Inventory Turnover or
365 / (Revenue/Ending Inventory)
- Days Payable Outstanding (DPO): 365 Days Divided by Accounts Payable Turnover or
365 / (Revenue/Ending Accounts Payable)
- Cash Conversion Cycle (CCC): Days Sales Outstanding plus Days Inventory Outstanding less Days Payable Outstanding (DSO + DIO – DPO)
In summary, it is advantageous for a company to minimize their DSO, DIO, and CCC metrics as working capital is not free – there is a cost for carrying working capital. On the flipside, it is advantageous for a company to maximize their DPO metric as the company is conserving cash. However, working capital metrics should be optimized by taking into consideration special terms negotiated with key customers that impact DSO, avoiding stock outs that impact DIO, and creating cash flow challenges for vendors that impact DPO.
New Constructs Analytics
Leveraging data and analytics provided by New Constructs, we calculated working capital metrics for each company included in the Russell 3000 Index. Previously, conducting such an analysis was infeasible due to technology limitations and scalability challenges. New Constructs has solved the technology challenge by automating the data gathering from SEC filings (including accompanying footnotes) that are required for the proper analysis of each company’s working capital metrics. Accounting distortions are removed for each company, providing a standardized, “one version of the truth” to benchmark each company against peer groups and across industry sectors. New Constructs updates it data base daily, so working capital metrics are available in real time.
Summarized in the table below are the working capital metrics (as of November 30, 2016,) for non-financial companies included in the Russell 3000 by sector:
Table 1: Russell 3000 (Figures in Millions of USD)

Sources: TechCXO, New Constructs, LLC, and company filings
- Working Capital as a % of Total Revenues is Significant: Total working capital for the Russell 3000 ($1.5 Trillion) represents 13% of total revenues ($11.5 Trillion). Accounts receivable represents the largest component of working capital. For the non-financial companies in the Russell 3000, their working capital metrics were as follows: DSO (41 Days); DIO (32 Days); DPO (26 Days); and CCC (47 Days).
- Metrics Vary Significantly Within and Across Sectors: Working capital metrics fluctuate significantly within sectors, especially between the top quartile companies vs. the bottom quartile companies. Across sectors, differences in working capital metrics can be more than 50 days:
- DSO: Consumer Staples Sector had the best DSO (18 Days) while the Industrial Sector had the worst DSO (62 Days).
- DIO: Telecom Sector had the best DIO (3 Days) while the Materials Sector had the worst DIO (56 Days).
- DPO: Utilities Sector had the best DPO (33 Days) while the Telecom Sector had the worst DPO (6 Days).
- CCC: Consumer Staples Sector had the best CCC (27 Days) while the Materials Sector had the worst CCC (83 Days).
Cheap Debt
When credit is cheap and plentiful, why should companies care about generating cash from working capital? For one thing, any money unnecessarily tied up in inventory, receivables, and payables is money that could be invested in strategic initiatives or returned to shareholders. Low interest rates will not last forever, and executives need to focus on funding sources other than debt.
Also, reducing working capital to free up cash is preferable to borrowing funds from a shareholder value / enterprise value perspective. In the example below (Table 2), we demonstrate how freeing up cash tied up in working capital improves a company’s Return on Invested Capital (ROIC) – while holding Net Operating Profit After Tax (NOPAT) constant – and shareholder value due to improved capital efficiency
Table 2: Freeing Up Working Capital vs. Increasing Debt
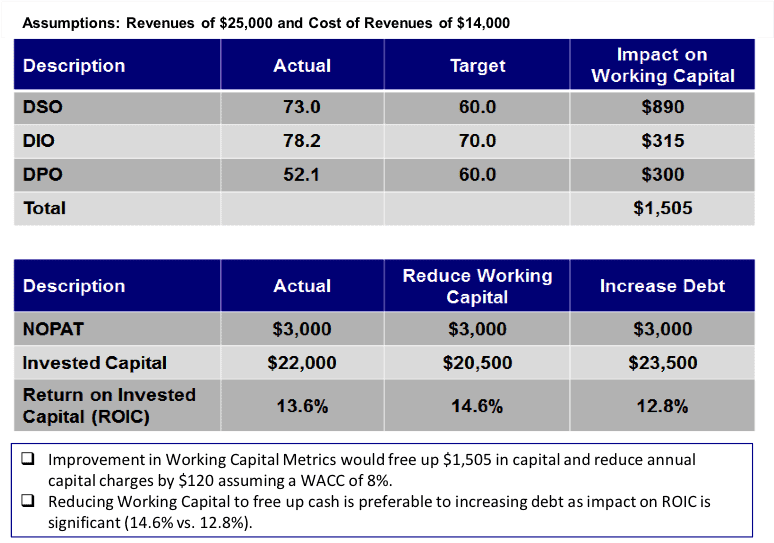
Sources: TechCXO, New Constructs, LLC, and company filings
Capital allocation is a senior management team’s most fundamental responsibility. The objective of capital allocation is to build long-term value. This principle is fundamental to value creation and the integrity of the capital markets. It applies to publicly-traded and privately-held companies at all stages of the life cycle. Capital efficiency is measured by the metric Return on Invested Capital. ROIC more impact on Enterprise Value than any other metric. For additional insights on the importance of ROIC as driver of enterprise value, see ROIC: The Paradigm For Linking Corporate Performance To Valuation.
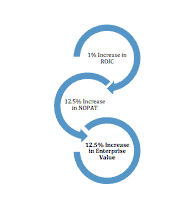
Increasing ROIC by just 1% can lead to significant increases in a company’s operating profits & enterprise value. For example, if a company’s ROIC is 8%, and its WACC is 8%, a 1% increase in ROIC leads to a 12.5% increase in Net Operating Profits and a 12.5% increase in enterprise value / shareholder value.
Recent surveys of finance executives show that only 20% say that all of their company’s liquidity needs are met through working capital. CFOs realize that their ability to finance their company’s growth initiatives depends on their finance function’s skill at improving working capital efficiency. Potential areas for improving working capital efficiency include: internal process improvements, better information management, increased use of electronic payments, and greater electronic integration with supply chain partners.
The Opportunity
Working capital comprises a significant portion of the total invested capital (working capital, PPE, goodwill and other intangibles) for companies in the Russell 3000. You create value for your company by investing capital to generate future cash flows at rates of return that exceed your cost of capital. Unless your company’s return on capital exceeds its cost of capital, no amount of revenue growth can create value. These principles apply equally to public companies as well as to privately-held enterprises.
Based on our analysis, we estimate that Russell 3000 companies can free up between $600 billion to $1 trillion by focusing on working capital optimization initiatives. For the Russell 3000, we calculated 2 scenarios to estimate the potential impact:
- Used average sector metrics from Table 1 and applied these metrics to the bottom quartile companies within each sector (See Table 3).
- Used top quartile sector metrics and applied these metrics to the bottom quartile companies within each sector (See Table 4).
Table 3: Average Sector Metrics Applied to Bottom Quartile Companies

Sources: TechCXO, New Constructs, LLC, and company filings
Table 4: Top Quartile Sector Metrics Applied to Bottom Quartile Companies

Sources: TechCXO, New Constructs, LLC, and company filings
From the sector perspective, the greatest opportunities for working capital improvement lie within the Consumer Discretionary and Industrials Sectors. The sectors with the least opportunities lie within the Utilities and Telecom Sectors.
Call to Action
Organizations of all sizes – public and private companies – can unlock significant value for their enterprises’ by optimizing their working capital metrics. The potential “Size of the Prize” is significant – $600 billion to $1 trillion for the Russell 3000 companies (non-financials). We also demonstrated that simply improving your ROIC by 1% can lead to a 12.5% increase in both Net Operating Profits and shareholder value. Our “Call to Action” for senior executives is to take a holistic view of their organization and concentrate on the following activities to drive sustainable shareholder value creation:
- Assessment of Working Capital Processes
- Define Desired Outcomes
- Formulate Solutions
- Align Stakeholder Expectations
Assessment of Working Capital Processes
Your first course of action is to understand the “current state” of your working capital processes and governance structure. Questions that need to be answered include the following:
- Does your company have a formal plan for managing working capital?
- Does your company have a significant understanding of cash management metrics and potential drivers for improvement?
- Does your company have the organizational structure and policies to identify, prioritize and manage working capital initiatives?
- Does your company and board have working capital incentive structures?
- Does your business unit/ functional management team have an operational understanding and clear visibility into working capital performance on an ongoing basis?
Define Desired Outcomes
Working capital optimization initiatives can provide benefits to enterprises beyond freeing up funds that can be reinvested in the business, including:
- Improved capital efficiency (DSO, DIO, DPO) linked to sustainable shareholder value creation
- Reduced reliance on external debt/capital
- Reduced operational and financial risks
- Higher enterprise valuations from the investment community
Formulate Solutions
Sustainable working capital improvements require an integrated approach across the entire enterprise that include the following activities:
- Develop and prioritize implementation plan
- Develop and execute communication and change management plan
- Implement solutions
- Design and implement monitoring dashboards and risk modeling
- Identify continuous improvement opportunities
Align Stakeholder Expectations
Top management is the most informed stakeholder for setting expectations for both external stakeholders (analysts, debt holders, shareholders) as well as internal stakeholders (Board of Directors, Business Unit Managers). Executives need to explain in a transparent manner how their capital allocation initiatives – including working capital strategy – align with the company’s path-to-growth strategy. This process also fortifies management’s stature with investors because it highlights managements’ focus on being responsible stewards of investor capital.
Organizations that excel at aligning expectations realize the following benefits:
- Reduced information asymmetry and better valuation
- Intrinsic value of enterprise aligned with market value
- Increased cash flows and ROIC
- Reduced litigation risk
- Valuation gaps reduced or eliminated
- Reduced stock price volatility and cost of capital
About the Authors
Dan O’Connor Partner TechCXO
Email: dan.oconnor@techcxo.com
LinkedIn: https://www.linkedin.com/in/dan-o-connor-ab911513
About TechCXO
TechCXO is an executive professional services firm that addresses our clients’ most critical functional and strategic issues in obtaining capital, entering new markets, increasing revenue, improving margins, and optimizing enterprise value.
David Trainer CEO New Constructs
Email: david.trainer@newconstructs.com
LinkedIn: https://www.linkedin.com/in/davidtrainer
About New Constructs
New Constructs leverages the latest in machine learning to analyze structured and unstructured financial data with unrivaled speed and accuracy. The firm’s forensic accounting experts work alongside engineers to develop proprietary NLP libraries and financial models based on the best fundamental data in the business for stocks, ETFs and mutual funds. Clients include many of the top hedge funds, mutual funds and wealth management firms. Partnerships with Thomson Reuters, Scottrade, Interactive Brokers and Ernst & Young provide leveraged distribution into multiple markets. David Trainer, the firm’s CEO, is regularly featured in Barron’s, Marketwatch.com, The Wall Street Journal and on CNBC as a thought leader on earnings quality, valuation and investment strategy.
Disclosures: David Trainer and Dan O’Connor receive no compensation to write about any specific stock, sector, style, or theme.
Click here to download a PDF of this report.
Photo Credit: CheapFullCoverageAutoInsurance.com (Flickr)