

Last week, we exposed the hidden interest expense from hidden debt and its impact on the entire S&P 500. This week, we name names. More details in the full report here.
$237 Billion in Hidden Costs For the S&P 500
First, some background. It’s no secret that debt has a cost, typically reported as interest expense on income statements. However, companies keep this interest expense off their income statement by holding trillions in obligations off-balance sheet through operating leases, residual value guarantees, and purchase commitments.
How large is the problem? Our footnotes analysis as of 2Q26 filings reveals $5.3 trillion in off-balance sheet debt for S&P 500 companies. This hidden debt translates into hidden interest expenses of $237 billion. If aggregate GAAP earnings for the S&P 500 are $2.67 trillion, then they are $2.43 trillion (or 9% lower) net of hidden interest expense.
At the individual company level, however, the impact is much greater since the hidden debt is concentrated in a small subset of S&P 500 companies.
Exposing the Worst Offenders: Downside Risk
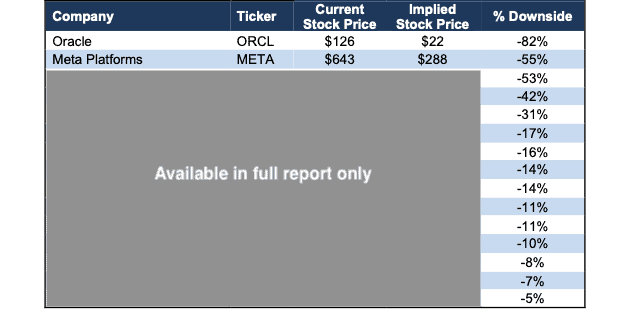
Figure 1 lists the stocks that should fall the most if investors adjust earnings to reflect the cost of hidden debt.
Downside risk is likely to grow as hidden debt and hidden interest expense increase substantially across the S&P 500. We will share updated numbers in the next few weeks after we analyze the footnotes of the 3Q26 filings. We’re warning investors now because the numbers are clearly big enough, and we think the reckoning for hidden debt is imminent as liquidity continues to tighten.
Figure 1: Top 15: Most Overpriced S&P 500 Stocks After Adjusting EPS for Hidden Interest Expense
Sources: New Constructs, LLC and company filings
We determine the “Implied Stock Price” in Figure 1 by:
- reducing reported GAAP earnings by the hidden interest expense for each company and
- multiplying the reduced earnings by the company’s current P/E ratio.
Oracle, the original “AI loser,” per our November 2025 report, holds the largest downside risk.
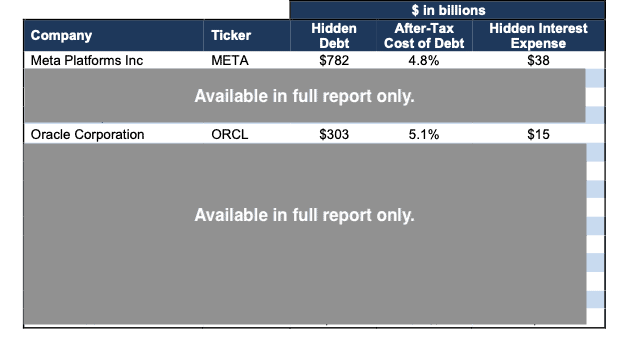
With $303 billion in hidden debt and an after-tax cost of debt of 5.1%, the company has $15.4 billion in hidden interest expense. For reference, Oracle reports $18.7 billion in GAAP earnings over the TTM.
We multiply $3.3 billion in earnings net of hidden interest expense by ORCL’s P/E ratio of 21.2 and find that the company’s stock price would be $22/share, or 82% below its current price. In other words, after adjusting for Oracle’s true cost of doing business, the stock should trade much lower.
Our calculations optimistically assume that the current P/E ratios hold steady after the market corrects for hidden interest expense. However, the market is more likely to punish these firms with lower P/E ratios in reaction to seeing not only lower earnings, but also lower earnings growth implied by the lower earnings. So, the downside is more likely to be worse than what we show.
Exposing the Worst Offenders: Hidden Interest Expense
Figure 2 in the full report shows the 15 companies with the most hidden interest expense in the S&P 500.
You won’t find this hidden interest expense quantified anywhere else because no one else does the diligence at scale and checks the footnotes for all the companies. As our clients can attest, all our work is 100% auditable. Our service makes it easy to trace every single footnote adjustment back to the source.
Figure 2: Top 15: Most Hidden Interest Expense in the S&P 500: TTM
Sources: New Constructs, LLC and company filings
Hidden Debt Distorts P/E Ratios
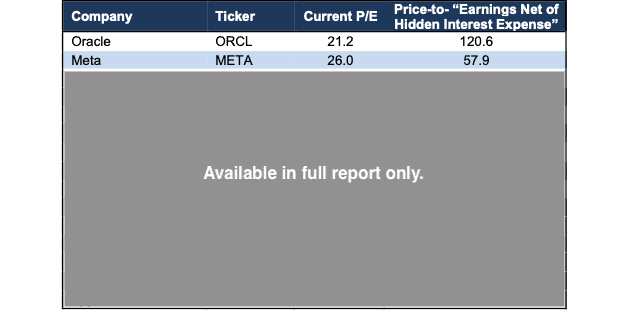
Figure 3 in the full report shows the implied P/E ratios for the companies in Figure 1 based on each company’s stock price and earnings net of hidden interest expense.
Based on reported GAAP earnings, Oracle trades at a 21.2 P/E ratio.
However, after we remove hidden interest expense and calculate earnings net of hidden interest expense, we see that its actually trading at a 120.6 price-to-“earnings net of hidden interest expense” ratio, or nearly 6x higher than the unadjusted P/E ratio.
The bottom line is that there are many stocks that are, in reality, much more expensive than investors think after adjusting for hidden interest expense.
Figure 3: Adjusted P/E Ratios Based on Earnings Net of Hidden Interest Expense
Sources: New Constructs, LLC and company filings.
The ultimate takeaway for investors: hidden debt creates hidden interest expense. Investors would be wise to keep this hidden expense in mind when reviewing earnings reports and positive headlines proclaiming record GAAP earnings.
When you account for the hidden interest expense, some of the most popular names in the market are both less profitable and more expensive than traditional measures indicate.
This article was originally published on October 27, 2026.
Disclosure: David Trainer and Kyle Guske II receive no compensation to write about any specific stock, style, or theme.
Questions on this report or others? Join our online community and connect with us directly.