
Monday marked the unofficial start of “earnings season.” Over the next few weeks, companies will scramble to present their operations in the most flattering light and analysts will declare that a one-cent EPS “miss” justifies a 15% haircut to a company’s valuation.
Then, once all the craziness has died down, the real earnings season—10-K filing season—will begin.
Corporate earnings announcements provide investors with limited, and often misleading, data. Only by reading the full financial footnotes, which are only included in annual 10-K reports filed with the SEC, can investors reverse accounting distortions and calculate true return on invested capital (ROIC).
Reported Earnings Per Share Don’t Matter
Historical data shows that reported earnings growth has a relatively limited impact on valuation both for individual companies and the market as a whole. Figure 1 shows that EPS growth rate has almost no correlation with P/E ratios for stocks in the S&P 500.
Figure 1: Earnings Growth Vs. P/E Ratio For The S&P 500
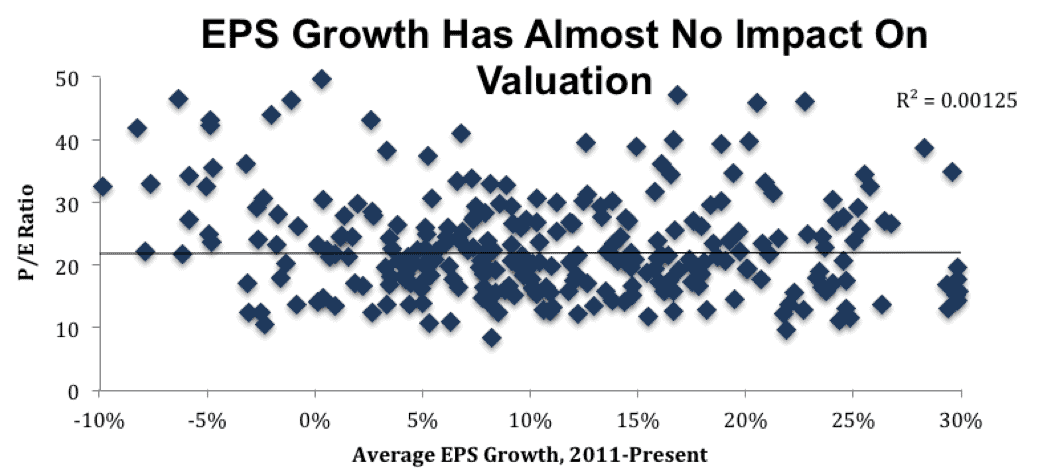
Sources: New Constructs, LLC and company filings.
Cash is a fact. Earnings are an opinion. Investors who base their investment decisions on accounting earnings put their portfolios at risk. Advisors who make investment recommendations without performing proper due diligence are not fulfilling their fiduciary responsibilities.
Using Machine Learning To Provide Diligence At Scale
ROIC does a much better job than EPS at explaining changes in valuation. Unfortunately for investors, it is incredibly difficult to calculate. It’s not enough to just look at the financial statements. A rigorous calculation of ROIC must account for items that can be buried in hundreds of pages of footnotes.
For a human analyst, performing this level of analysis on just a handful of companies can be a daunting task. Applying that level of rigor to thousands of companies is downright impossible. That’s where our technology comes in.
We use machine learning and natural language processing to automate a good deal of the analysis of corporate filings. Our statistical comparison engine, which has been trained on over 120,000 human-verified filings and grows more sophisticated everyday, can filter through SEC filings to recognize and tag important data, automatically building company models.
Of course, human analysts remain a vital part of the process. From mid-February through the end of March, our expert team of analysts will be coming in early and staying late to validate the data and models built by the machine and interpret unusual items that cannot be automatically processed.
This combination of computerized processing power and human expertise allows us to provide investors with the most accurate data based on the real earnings season.
Diligence Pays
All stock research is ultimately judged on one metric: the performance of its picks. Over the past year, our in-depth research has helped deliver excess returns to investors.
Most notably, our Executive Compensation Aligned With ROIC Model Portfolio is up 23% vs. 9% for the S&P 500 since its inception in May of last year. This model portfolio combines our footnotes research with evaluation of executive compensation plans to find profitable, attractively valued companies with incentives for executives to efficiently allocated capital and maximize ROIC.
Hawaiian Holdings (HA) has been in the Exec Comp model portfolio since its inception and is up 33% over that time. We also added it to our Most Attractive Stocks list in May. In addition to its stellar executive compensation plan, we found a couple of items in the footnotes of HA’s 10-K that revealed the company was more profitable than it appeared.
On page 67, we found unusually high interest and actuarial pension costs that reduced HA’s pre-tax net income by $22 million. These are non-operating expenses that can be highly variable and do not reflect the actual profitability of the business.
On page 92, we found a $2 million increase to the company’s inventory reserve. Increasing reserves does not affect the actual cash flow of the company, but it does decrease reported profits.
Eliminating these $24 million in hidden non-operating expenses (13% of reported GAAP net income) revealed a significant increase in HA’s cash flow and ROIC and made it one of our top picks for 2016.
Diligence in the footnotes can also protect investors against capital losses.
Acadia Healthcare (ACHC) showed rapid growth in reported earnings per share over the past few years, but our models showed cash flow and ROIC on the decline. We warned investors about this disconnect last July, and the stock is down 31% since that time while the S&P is up 5%.
Rather than chasing the news during the current earnings season, investors should rely on fundamental diligence during 10-K season to drive long-term success.
This article originally published here on January 11, 2017.
Disclosure: David Trainer, Lindsay Bohannon, and Sam McBride receive no compensation to write about any specific stock, sector, style, or theme.
Scottrade clients get a Free Gold Membership ($588/yr value) as well as 50% discounts and up to 20 free trades ($140 value) for signing up to Platinum, Pro, or Unlimited memberships. Login or open your Scottrade account & find us under Quotes & Research/Investor Tools.
Click here to download a PDF of this report.
Photo Credit: Ken Teegardin (Flickr)