Summary
A key component of our Predictive Rating, Total Annual Costs reflect the all-in cost of a minimum investment in each fund assuming a 3-year holding period, the average holding period for mutual funds[1].
This rating reflects all expenses, loads, fees and transaction costs in a single value that is comparable across all funds, i.e. ETFs and mutual funds.
In each of our ETF and mutual fund reports, we also provide the ‘Accumulated Total Costs vs Benchmark’ analysis to show investors, in dollar-value terms, how much money comes out of the their pocket to pay for fund management. This analysis assumes a $10,000 initial investment and a 10% annual return for both the fund and the benchmark – so comparison between the fund and benchmark is apples-to-apples.
Our goal is to give investors as accurate a measure as possible of the cost of investing in every fund to determine whether this cost of active management is worth paying.
Details
The Total Annual Costs Ratings are calculated using our proprietary Total Annual Costs metric, which is my apples-to-apples measure of the all-in costs of investing in any given fund.
Total Annual Costs incorporates the expense ratio, front-end load, back-end load, redemption fee, transaction costs and opportunity costs of all those costs. In other words, Total Annual Costs captures everything to give investors as accurate a measure as possible of the costs of being in any given fund.
Total Annual Costs are calculated assuming a 10% expected return and a 3-yr holding period, the average holding period for mutual funds[1].
Total Annual Costs is the incremental return a fund must earn above its expected return in order to justify its costs. For example, a fund with Total Annual Costs of 8% and an expected return of 10% must earn a gross return of 18% to cover its costs and deliver a 10% return to investors.
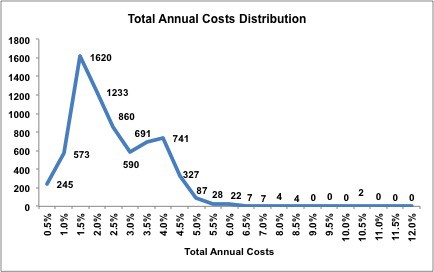
The following chart shows the distribution of the Total Annual Costs for the 400+ ETFs and 7000+ mutual funds we cover.
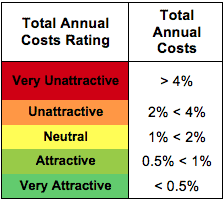
Thresholds used for determining the Total Annual Costs rating.
Total Annual Costs Components:
- Expense Ratio: Funds disclose multiple expense ratios within their prospectuses, quarterly report and annual reports. We use the net prospectus expense because it is forward-looking, comparable across all funds and represents the expense ratio investors expect to pay when purchasing the fund.
- Front-end Load: Fee paid to the selling broker when shares of the mutual fund are purchased. This load decreases the initial investment.
- Back-end Load: Fee paid directly to the brokers when shares of the mutual fund are sold. This fee is calculated by multiplying the back-end load ratio by the initial investment, ending investment, or the lesser of the two. For the purposes of our calculation we assume that back-end loads are always calculated using the initial investment. Since we assume a 3-year holding period, our Total Annual Cost metric uses the 3-year back-end load ratio.
- Redemption Fee: Similar to a back-end load except that a redemption fee is typically used to defray fund costs associated with the shareholder’s redemptions and is paid directly to the fund where as back-end loads are paid directly to the brokers. For the purposes of our calculation we treat redemption fees the same as back-end loads. Most redemption fees expire in less that one-year and since we assume a 3-yr holding period, redemption fees only impact the Total Annual Costs rating of four mutual funds.
- Transaction Costs: Costs incurred by a fund as it buys and sells securities throughout the year. Transactions costs are not incorporated in a fund’s expense ratio but rather are taken directly out of shareholder assets. Transaction costs are difficult to calculate and are not included in the prospectus or the annual reports. We calculate transaction costs by multiplying the portfolio turnover by a proprietary transaction cost multiplier.
- Opportunity Costs: The difference in return between a chosen investment and one that is necessarily passed up. Each of the five costs described above have associated opportunity costs because they reduce the amount of money an investor puts to work in a fund. Our opportunity costs are calculating assuming a 10% expected return.
[1] http://www.fpanet.org/docs/assets/ED882BE0-061A-825D-371EC05B8B20E3E3/FPAJournalNovember2001-InvestorsBehavingBadly_AnAnalysisofInvestorTradingPatt1.pdf
[1] http://www.fpanet.org/docs/assets/ED882BE0-061A-825D-371EC05B8B20E3E3/FPAJournalNovember2001-InvestorsBehavingBadly_AnAnalysisofInvestorTradingPatt1.pdf

