Check out this week’s Danger Zone interview with Chuck Jaffe of Money Life.
The most anticipated IPO in years is almost here. Ridesharing giant Uber (UBER: $100 billion rumored valuation) filed its preliminary S-1 on Thursday, April 11, and it will reportedly begin trading in May. While the company has not yet provided pricing details, it is rumored to be seeking a valuation of ~$100 billion. At this proposed valuation, UBER currently earns our Unattractive rating.
In almost every respect, Uber looks even more dangerous than Lyft (LYFT), which is already down 20% from its overvalued IPO price. Uber is growing at a slower rate than Lyft, loses much more money, and has an expected market cap that is ~5x higher. Lyft’s troubled IPO seems to have dampened enthusiasm for Uber, which in turn is driving Lyft’s stock even further down. This feedback loop just shows that the valuations of these two companies only make sense in comparison to one another, and not to fundamentals or the rest of the market.
Numbers Don’t Back Up Growth Story
We’re not going to talk about Uber’s losses here, even though the amount of money the company loses ($3.0 billion in 2018) is astonishing. Everyone knows Uber loses money. At this point, the amount of money you’re able to lose seems to be a point of pride in Silicon Valley.
Instead, let’s talk about the story Uber wants to highlight for investors. According to Uber, they are still in the early stages of capturing what they estimate to be a $12 trillion (yes, that’s trillion with a “T”) total addressable market that includes personal mobility, food delivery, and freight shipping. For context, the World Bank estimates that global GDP was ~$80 trillion in 2017. Uber is saying they think they can capture 15% of global economic activity.
If that goal was remotely feasible, and Uber was at less than 1% of its total addressable market, you’d expect the company’s revenue growth to be rapidly accelerating. Instead, Uber’s revenue growth rate declined from 106% in 2017 to 42% in 2018. Even that number overstates Uber’s growth, as it doesn’t account for the extra incentives given to drivers. Uber’s Core Platform Adjusted Net Revenue, which strips out driver incentives, grew by just 39% in 2018, and it actually declined quarter-over-quarter in Q4 ’18.
Figure 1: UBER Adjusted Net Revenue and Gross Bookings: Q1 ’17 – Q4 ‘18
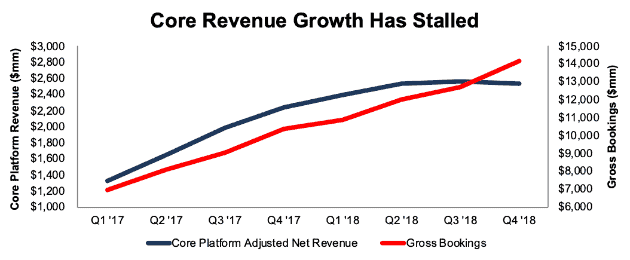
Sources: New Constructs, LLC and company filings
Uber’s Gross Bookings – the total amount of money spent by users on the platform – increased by 11% in Q4, but core net revenue declined by 1%. This disconnect shows the key problem with Uber’s theory of world domination: as Uber tries to protect and expand its market share around the world, it’s giving up a larger share of revenue to drivers and restaurants, a trend we expect to continue unabated.
Alarming Decline in “Take Rate” Will Continue
Uber’s Take Rate, the percentage of Gross Bookings it captures as Core Platform Adjusted Net Revenue, has been in steady decline throughout 2018. Figure 2 shows that the company’s take rate declined from 22% in Q1 to 18% in Q4.
Figure 2: UBER Take Rate: Q1 ’17 – Q4 ‘18
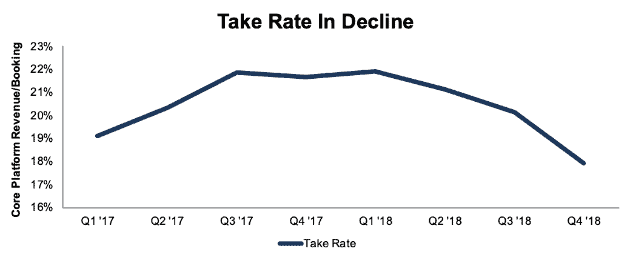
Sources: New Constructs, LLC and company filings
Uber’s declining Take Rate in 2018 stands in stark contrast to 2017, when its Take Rate increased from 19% to 22% over the course of the year.
It’s not hard to see what caused this reversal. Uber’s attempt to squeeze drivers in 2017, along with a series of PR disasters that led to the #DeleteUber campaign, drove both riders and drivers to other platforms, like Lyft. According to data firm Second Measure, Uber’s share of the U.S. rideshare market declined from 82% at the beginning of 2017 to 71% at the end of the year.
The U.S. rideshare market is not the only market where Uber is losing share. Internationally, the company has been forced to throw in the towel in China, Russia, and Southeast Asia in recent years. Meanwhile, Uber Eats is losing share to DoorDash domestically.
Uber’s added incentives for riders and drivers have helped stem the market share losses – its domestic market share declined by a smaller amount, from 71% to 67%, in 2018. Despite its efforts to improve its image, Uber’s brand still has a worse reputation than Lyft with consumers, and its drivers recently went on strike in Los Angeles. It’s no surprise that Uber drivers are upset, as one recent study suggests they only earn ~$9/hour after accounting for all costs involved.
In light of these ongoing struggles, one line from Uber’s S-1 stood out. On page 30, Uber writes:
“As we aim to reduce Driver incentives to improve our financial performance, we expect Driver dissatisfaction will generally increase.”
Uber can’t achieve profitability without squeezing drivers, but if it tries to squeeze drivers it will lose market share. With wages rising at the fastest pace in a decade – and growing even faster for low earners – it seems likely that Uber’s take rate will decline even further in 2019.
Companies like Bolt in Europe have shown that it’s possible to operate a ridesharing app profitably, but you can’t do so while simultaneously trying to achieve a dominant market share worldwide. Uber can be a huge company, or it can be a profitable company, but it can’t be both.
Uber Has No Competitive Advantages
Uber’s declining market share and take rate highlight the core problem the company faces: it has no real competitive advantage that will allow it to earn a sustainably high return on invested capital (ROIC). Uber bulls would dispute this claim. They’ll argue that the company’s scale gives it a network effect that will lead to a long-term competitive advantage.
Uber even makes this claim explicitly, writing on Page 152:
“Our strategy is to create the largest network in each market so that we can have the greatest liquidity network effect, which we believe leads to a margin advantage.”
Uber believes that as it grows its user base, it gains a competitive advantage over its rivals. Riders want to use a platform with lots of drivers, which minimizes wait times, and drivers want to use a platform with lots of riders so they have consistent fares. In theory, by achieving the largest scale, Uber’s network should represent a sustainable competitive advantage over its rivals.
In practice, Uber is losing billions of dollars of a year and its market share is declining. The company’s fundamentals certainly don’t back up the idea that it has any real competitive advantage. There are two key reasons why network effects don’t make much of a difference in the ridesharing space:
- Low Switching Costs: It is easy for both drivers and riders to use multiple ridesharing apps. Roughly 70% of drivers work for both Uber and Lyft, and smaller services such as Juno have easily grown by piggybacking off that network. The only switching cost involved for users of these platforms is the time it takes to close one app and open another. Switching cost are inconsequential for drivers too, especially for new rideshare apps that can use driver ratings from Lyft and Uber as a lower-cost way to screen drivers.
- No Scale Effects: The bulk of Lyft and Uber use comes within a single city. In fact, Uber discloses that 24% of its bookings comes from just five cities: New York, San Francisco, LA, London, and Sao Paolo. The localized nature of the ridesharing industry means that competitors can make inroads by focusing on a single city. If a startup can attract enough riders and drivers in a single city, it doesn’t matter if Uber has a superior network worldwide.
Uber Vs. Facebook: Not Even Close
Despite its clear lack of a competitive advantage, Uber’s rumored IPO price values the company as if it will benefit from a powerful network effect in the future. In fact, its potential $100 billion market cap equals Facebook (FB) when it IPO’d in 2012.
Facebook, unlike Uber, does have a real competitive advantage from its network effect. That competitive advantage has helped Facebook crush smaller competitors, such as Snapchat (SNAP), and it shows up in the company’s top-quintile ROIC of 41%.
The contrast between Facebook and Uber is striking. Figure 3 compares the two companies by operating profit, revenue growth, and number of users in the year before their IPO.
Figure 3: UBER vs. Facebook: Year Before IPO

Sources: New Constructs, LLC and company filings
In the leadup to their respective IPO’s, Facebook earned nearly $2 billion in profits while Uber lost almost $3 billion. Facebook also was growing twice as fast and had over ten times as many users.
The fact that Uber might get the same market cap at its IPO as Facebook did, despite far worse operating results, shows just how irrational the market has become over the past seven years.
Valuation Is Almost Impossible to Justify
As Uber’s IPO nears, the company is scrambling to find ways to justify the rumored $100 billion+ valuation. Their current strategy is to tout the company’s self-driving car unit. According to the Wall Street Journal, Uber is finalizing an investment deal with SoftBank and other investors that would value its self-driving car unit at over $7 billion.
It makes sense that Uber wants to distract investors from its huge losses and slowing growth by dangling the promise of self-driving cars. However, there’s no reason to believe they have an advantage and chance of making money in this industry, either. In fact, analysis from Navigant shows Uber lagging far behind leaders such as GM Cruise (GM) and Waymo (GOOGL) in the self-driving space.
SoftBank, as a major investor in Uber as a whole, will be more than happy to commit more money if it helps boost the IPO price. Public investors, however, shouldn’t be fooled into thinking that self-driving cars will be the magic bullet that allows Uber to become profitable.
The most reasonable path we see to profitability for Uber is a scenario where the company manages to create duopolies/oligopolies with competitors in its various markets, a la the airline industry after consolidation.
If we assume Uber can earn airline-like pretax margins of 8% by the end of next year (current pre-tax margins are -24%), the company must grow revenue by 40% compounded annually for the next 7 years to justify its valuation. See the math behind this dynamic DCF scenario.
In this scenario, Uber would earn $119 billion in revenue in 2025. At its Q4 take rate, that equates to over $650 billion in gross bookings. Meanwhile, Goldman Sachs estimates that the total size of the global ridesharing industry will be just $285 billion in 2030.
As with Lyft, we think the ceiling on Uber’s valuation is the amount of capital it took to build out its platform. The company’s prospects for profitability on its own are slim, so its best chance is to partner with/be acquired by a larger company like Alphabet that develops its own self-driving technology. In this scenario, the acquiring company asks the inevitable “build or buy” question: should we pay $100 billion for Uber or spend $22 billion, what Uber spent to get to where it is today?
There are many good arguments that one could build the equivalent of Uber’s network with a lot less capital. Look no farther than Bolt in Europe, which has only spent $100 million (and is actually making money) to build a user base larger than Lyft’s.
The bottom line: it is hard to justify paying anything more than $22 billion for Uber, a 78% downside to the proposed IPO valuation.
Public Shareholders Have Rights
If there’s one bright spot in the midst of Uber’s ugly S-1, it’s that public shareholders will actually have a say in corporate governance. Unlike almost every other recent IPO, Uber will eschew a dual-class share structure and go public with only a single class of common stock. The fundamentals might be ugly, but we’re glad to see Uber sticking to the principle of one share = one vote.
Critical Details Found in Financial Filings by Our Robo-Analyst Technology
As investors focus more on fundamental research, research automation technology is needed to analyze all the critical financial details in financial filings. Below are specifics on the adjustments[1] we make based on Robo-Analyst[2] findings in Uber’s S-1:
Income Statement: we made $8 billion of adjustments, with a net effect of removing $3.1 billion in non-operating income (27% of revenue). Our biggest adjustment was the removal of a $3.2 billion gain on sale of the company’s Southeast Asia business. You can see all the adjustments made to UBER’s income statement here.
Balance Sheet: we made $10 billion of adjustments to calculate invested capital with a net decrease of $1.9 billion. You can see all the adjustments made to UBER’s balance sheet here.
Valuation: we made $12.4 billion of adjustments with a net effect of decreasing shareholder value by $11.7 billion. You can see all the adjustments made to UBER’s valuation here.
This article originally published on April 22, 2019.
Disclosure: David Trainer, Kyle Guske II, and Sam McBride receive no compensation to write about any specific stock, style, or theme.
Follow us on Twitter, Facebook, LinkedIn, and StockTwits for real-time alerts on all our research.
[1] Ernst & Young’s recent white paper “Getting ROIC Right” demonstrates the link between an accurate calculation of ROIC and shareholder value.
[2] Harvard Business School Features the powerful impact of research automation in the case study New Constructs: Disrupting Fundamental Analysis with Robo-Analysts.