
The Utilities sector ranks tenth out of the ten sectors as detailed in my Sector Rankings for ETFs and Mutual Funds report. It gets my Very Dangerous rating, which is based on aggregation of ratings of 9 ETFs and 33 mutual funds in the Utilities sector as of July 17,2014. Prior reports on the best & worst ETFs and mutual funds in every sector are here.
Figure 1 rank from best to worst all nine Utilities ETFs and Figure 2 shows the five best and worst-rated Utilities mutual funds. Not all Utilities sector ETFs and mutual funds are created the same. The number of holdings varies widely (from 21 to 79). This variation creates drastically different investment implications and, therefore, ratings. The best ETFs and mutual funds allocate more value to Attractive-or-better-rated stocks than the worst ETFs and mutual funds, which allocate too much value to Neutral-or-worse-rated stocks.
To identify the best and avoid the worst ETFs and mutual funds within the Utilities sector, investors need a predictive rating based on (1) the stocks ratings of the holdings, (2) the all-in expenses of each ETF and mutual fund, and (3) the fund’s rank compared to all other ETFs and mutual funds. As a result, only the cheapest funds with the best holdings receive Attractive or better ratings. Investors need not rely on backward-looking ratings. My fund rating methodology is detailed here.
Investors should not buy any Utilities ETFs or mutual funds because none get an Attractive-or-better rating. If you must have exposure to this sector, you should buy a basket of Attractive-or-better rated stocks and avoid paying undeserved fund fees. Active management has a long history of not paying off. Here’s the list of our top-rated Utilities stocks.
Get my ratings on all ETFs and mutual funds in this sector on my free mutual fund and ETF screener.
Figure 1: ETFs with the Best & Worst Ratings
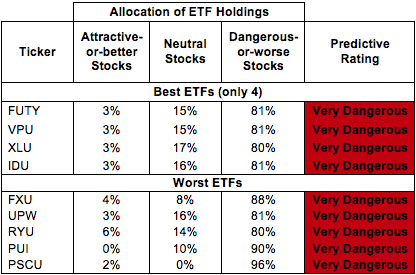
* Best ETFs exclude ETFs with TNAs less than $100 million for inadequate liquidity.
Sources: New Constructs, LLC and company filings
Figure 2: Mutual Funds with the Best & Worst Ratings – Top 5
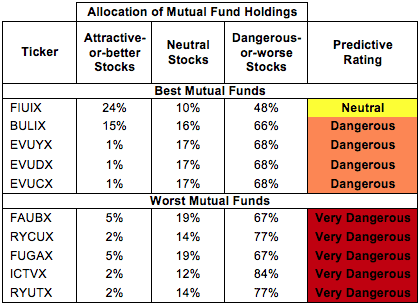
* Best mutual funds exclude funds with TNAs less than $100 million for inadequate liquidity.
Sources: New Constructs, LLC and company filings
Fidelity MSCI Utilities Index ETF (FUTY) is my top-rated Utilities ETF and Fidelity Devonshire Trust: Fidelity Telecom & Utilities Fund (FIUIX) is my top-rated Utilities mutual fund. FUTY earns my Very Dangerous rating and FIUIX earns my Neutral rating.
PowerShares S&P SmallCap Utilities Portfolio ETF (PSCU) is my worst rated Utilities ETF and Rydex Series Funds: Utilities Fund (RYUTX) is my worst-rated Utilities mutual fund. Both earn my Very Dangerous rating.
Figure 3 shows that 7 out of the 130 stocks (only 3% of the market value) in Utilities ETFs and mutual funds get an Attractive-or-better rating. Also, 0 out of 9 Utilities ETFs and 0 out of 33 Utilities mutual funds get an Attractive-or-better rating.
The takeaways are: mutual fund managers allocate too much capital to low-quality stocks and Utilities ETFs hold poor quality stocks.
Figure 3: Utilities Sector Landscape For ETFs, Mutual Funds & Stocks
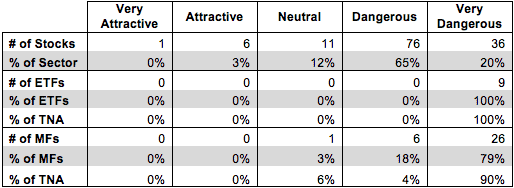
Sources: New Constructs, LLC and company filings
As detailed in “Cheap Funds Dupe Investors”, the fund industry offers many cheap funds but very few funds with high-quality stocks, or with what I call good portfolio management.
Investors need to tread carefully when considering Utilities ETFs and mutual funds, as no ETFs or Utilities mutual funds in the Utilities sector allocate enough value to Attractive-or-better-rated stocks to earn an Attractive rating. Investors wanting to allocate to this sector should look toward individual stocks instead.
Consolidated Edison, Inc. (ED) is one of my favorite stocks held by Utilities ETFs and mutual funds and earns my Attractive rating. Over the past decade, ED has grown after-tax profits (NOPAT) by 9% compounded annually. Over this same time, the company has been able to increase its NOPAT margin from 9% in 2003 to 16% in 2013. Despite this impressive, long-term profit growth, ED remains undervalued. At its current price of ~$57/share, ED has a price to economic book value (PEBV) ratio of 0.8. This ratio implies the market expects ED’s NOPAT to permanently decline by 20% from its current levels. While utility companies aren’t known for their high growth rates, ED has shown the ability to consistently grow NOPAT, making the market expectations overly pessimistic. ED should easily surpass such low expectations.
Ameren Corporation (AEE) is one of my least favorite stocks held by Utilities ETFs and mutual funds and earns my Very Dangerous rating. AEE has not meaningfully grown NOPAT when compounded annually for the last six years. At the same time, the company currently earns a return on invested capital (ROIC) of 3%, placing it in the bottom quintile of all 3000 companies I cover. AEE has also generated negative economic earnings every year for the past decade. Despite the poor performance of the company’s profits, the stock price remains elevated. To justify its current price of ~$39, AEE would have to grow NOPAT by 6% compounded annually for the next 36 years. One must be overly optimistic to believe a company that hasn’t grown in the last six years would be able to sustain a 6% growth rate for such an extended period of time.
80 stocks of the 3000+ I cover are classified as Utilities stocks.
Figures 4 and 5 show the rating landscape of all Utilities ETFs and mutual funds.
My Sector Rankings for ETFs and Mutual Funds report ranks all sectors and highlights those that offer the best investments.
Figure 4: Separating the Best ETFs From the Worst ETFs
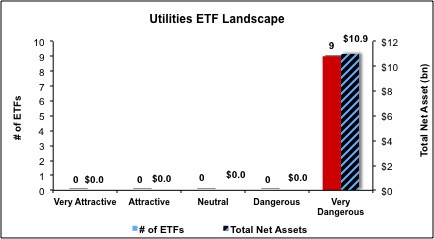
Sources: New Constructs, LLC and company filings
Figure 5: Separating the Best Mutual Funds From the Worst Mutual Funds
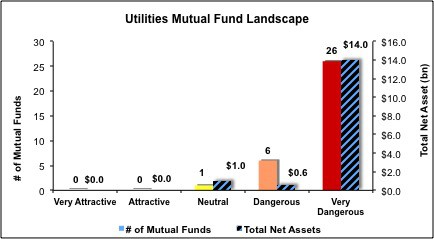
Sources: New Constructs, LLC and company filings
Review my full list of ratings and rankings along with reports on all 9 ETFs and 33 mutual funds in the Utilities sector.
Kyle Guske II contributed to this report.
Disclosure: David Trainer and Kyle Guske II receive no compensation to write about any specific stock, sector or theme.