As part of our rigorous commitment to providing the best valuation models and investment research, we are constantly reviewing and updating our processes, methodologies and analytics. We recently discovered an opportunity to improve upon our cost of capital (WACC) calculations for the 5,000+ models we manage for clients.
This report explains the update and details the impact it has on our models and investment ratings as we aim to continue to be as transparent as possible about our methodologies and models.
What Is WACC?
WACC represents the weighted average of the costs of all external funding sources for a company. These costs either come from interest payments on debt or the return that shareholders expect in order to be compensated for the risk they take.
WACC is a vital metric because it serves as the hurdle rate for Return on Invested Capital (ROIC). A company must earn an ROIC greater than its WACC in order to generate positive economics earnings for investors.
WACC also serves as the denominator in our calculation of Economic Book Value (EBV). When WACC goes down, EBV goes up, and vice versa.
The Impact on our Models
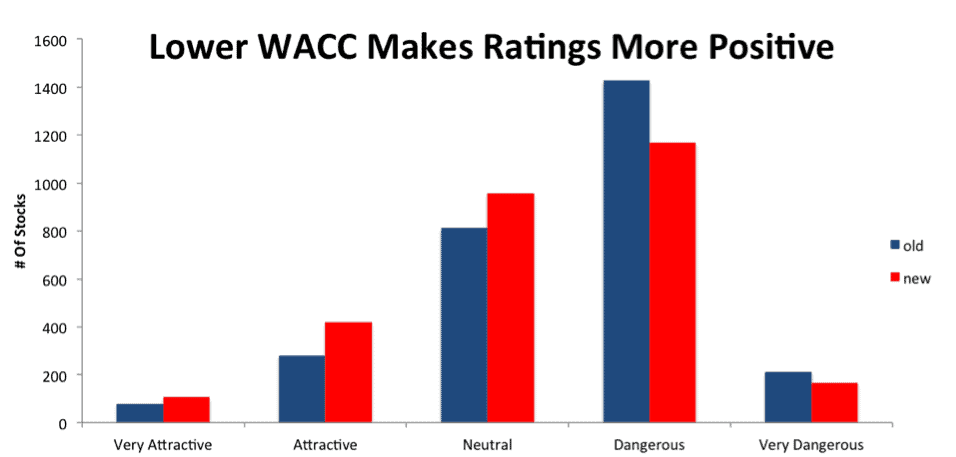
Figure 1 shows how our change in our WACC calculation impacts our ratings. The change to the methodology, which will be discussed more below, lowers WACC by ~1.25% on average for companies we cover. As a result, economic earnings and EBV for these companies improves, and our ratings become more positive as a whole.
Figure 1: Ratings Distribution: Old WACC Vs. Updated WACC
Sources: New Constructs, LLC and company filings.
What’s Changed?
We have identified a better, more market-based source for the company credit ratings we use to calculate a company’s debt spread. The debt spread is the excess interest burden a company faces to take on debt versus the risk-free rate. Our updated calculation of the debt spread matches a company’s credit rating to the yield on an index of similarly rated corporate bonds.
This change in credit ratings helps our debt spread calculation to better reflect the real market environment for borrowing in a number of ways:
- We get market-driven updates for credit ratings monthly instead of quarterly.
- The new credit ratings provide more granularity for more precise tracking of the cost of borrowing for companies with different ratings.
- More transparency in the market rates for the debt of non-investment grade companies means more accurate borrowing costs for our models.
To align it with the new credit rates and, we’ve also changed our benchmark for the risk-free rate. Before, we used the yield on the 30-year Treasury Bond. Now, we will use the yield on 5-year zero-coupon Treasury STRIPS, which tends to be significantly lower.
How The Changes Impact Your Portfolio
Most customers should expect to see a slight ratings improvement for their stocks. For instance, anyone who has Johnson & Johnson (JNJ) in their portfolio will see it upgraded from Attractive to Very Attractive. The 1.25% decrease in JNJ’s WACC has increased its EBV and made the valuation more appealing.
On the other hand, there are a few stocks that have been downgraded due to their updated WACCs. For instance, Taubman Centers (TCO) sees its rating bumped down from Neutral to Dangerous. Our new credit rating data increased TCO’s WACC from 6.91% to 7.55%, making the stock slightly more expensive and its economic earnings lower.
Any stock whose rating is impacted by the WACC update will have an Upgraded/Downgraded notification with “Cause: Updated WACC” in the Analyst Notes column of the Stock Screener and My Portfolio page.
When You Will See the Change: Friday, December 16
The changes described above will appear on our site the morning of Friday, December 16. Affected companies will be marked with the Analyst Note “Updated WACC.” For more information on this Analyst Note, along with all other Analyst Notes, click here.
This article originally published here on December 16, 2016.
Disclosure: David Trainer, Lindsay Bohannon, and Sam McBride receive no compensation to write about any specific stock, sector, style, or theme.