
Wall Street analysts are too bullish on second quarter earnings expectations for most S&P 500 companies. Although down from record highs set in early 2021, the percentage of S&P 500 companies whose Street EPS exceeds our Core EPS[1] remains high at 69%.
This report shows:
- the frequency and magnitude of overstated Street Earnings [2] in the S&P 500 and
- five S&P 500 companies likely to miss 2Q23 earnings.
Get our report on the S&P 500 companies most likely to beat 2Q23 Street EPS estimates here.
Street EPS Are Higher Than Core EPS for 347 S&P 500 Companies
For 347 companies in the S&P 500, or 69%, Street Earnings are higher than Core Earnings in the TTM ended 1Q23. In the TTM ended 4Q22, Street Earnings were overstated for 339 companies.
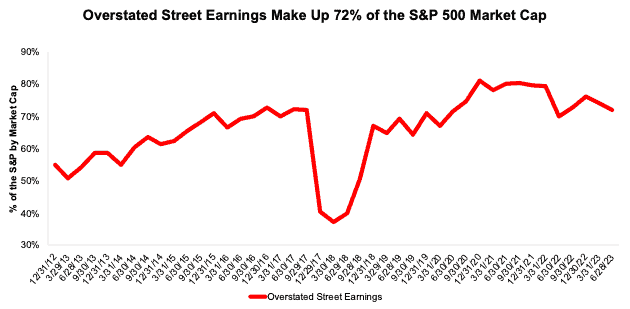
The 347 companies with overstated Street Earnings make up 72% of the market cap of the S&P 500 as of 6/28/23, which is down from 74% in 4Q22, measured with TTM data in each quarter.
Figure 1: Overstated Street Earnings as % of Market Cap: 2012 through 6/28/23
Sources: New Constructs, LLC and company filings.
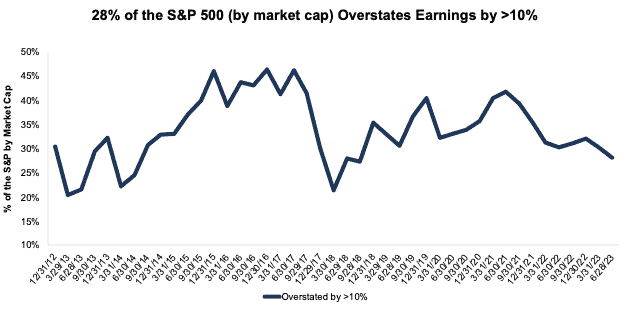
For over a third of the S&P 500 (198 companies), Street Earnings are overstated by more than 10% vs. Core Earnings.
Figure 2: Overstated Street Earnings by >10% as % of Market Cap: 2012 through 6/28/23
Sources: New Constructs, LLC and company filings.
When Street Earnings are higher than Core Earnings, they are overstated by an average of 22%, per Figure 3.
Figure 3: Street Earnings Overstated by 19% on Average in TTM Through 1Q23

Sources: New Constructs, LLC and company filings.
Five S&P 500 Companies Likely to Miss 2Q23 Earnings
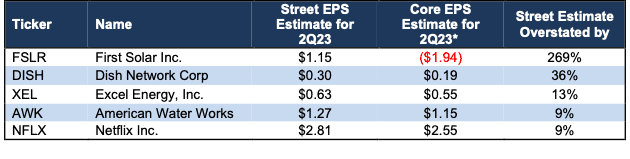
Figure 3 shows five S&P 500 companies likely to miss calendar 2Q23 earnings because their Street EPS estimates are overstated. Below, we detail the hidden and reported unusual items that caused the overstated Street Earnings in the TTM ended 1Q23 for DISH Network (DISH: $7/share). Because investors and analysts tend to anchor their earnings projections to historical results, errors in historical Street EPS lead to errors in Street EPS estimates.
Figure 4: Five S&P 500 Companies Likely to Miss 2Q23 EPS Estimates
Sources: New Constructs, LLC, company filings, and Zacks
*Assumes Street Distortion as a percent of Core EPS is the same for 2Q23 EPS as for TTM ended 1Q23.
DISH Network: The Street Overestimates Earnings for 2Q23 by 36%
The Street’s 2Q23 EPS estimate of $0.30/share for DISH Network is $0.11/share higher than our estimate for 2Q23 Core EPS of $0.19/share. Large gains on derivatives and investment securities drive much of the difference between Street and Core EPS estimates. After removing these non-recurring gains, our analysis of the entire S&P 500 reveals DISH Network as one of the companies most likely to miss Wall Street analysts’ expectations in its 2Q23 earnings report.
DISH Network’s Earnings Distortion Score is Strong Miss and its Stock Rating is Unattractive, in part due to its bottom-quintile return on invested capital (ROIC) of 3%, -13% free cash flow (FCF) yield, price-to-economic book value (PEBV) ratio of -0.3, and market-implied growth appreciation period (GAP) of >100 years.
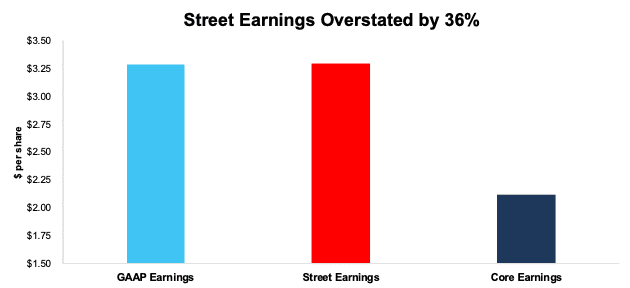
Below we detail the unusual gains that materially boost and distort DISH Network’s TTM 1Q23 Street and GAAP earnings. After removing all unusual items, we find that DISH Network’s TTM 1Q23 Core EPS are $2.11/share, which is lower than TTM 1Q23 Street EPS of $3.29/share and GAAP EPS of $3.28/share.
Figure 5: Comparing DISH Network’s GAAP, Street, and Core Earnings: TTM Through 1Q23
Sources: New Constructs, LLC and company filings.
Figure 5 shows the differences between DISH Network’s Core Earnings and GAAP Earnings so readers can audit our research. Given the small difference between GAAP and Street Earnings, the adjustments that drive the difference between Core and Street Earnings are likely mostly the same.
Figure 6: DISH Network’s GAAP Earnings to Core Earnings Reconciliation: TTM 1Q23

Sources: New Constructs, LLC and company filings.
More details:
Total GAAP Earnings Distortion of $1.17/share, which equals $745 million, is comprised of the following:
Reported Unusual Gains, Net = $1.51/per share, which equals $965 million and is comprised of
- $943 million in “Other Income (Expense)” due to derivative instruments in the TTM period based on
- -$29 million loss in 1Q23
- $923 million gain in 4Q22
- $34 million gain in 3Q22
- $15 million gain in 2Q22
- DISH Network disclosed in the footnotes that these net gains were due to realized and/or unrealized gains on derivative instruments.
- -$1 million in costs related to early redemption of debt in the TTM period based on
- <$0.1 million gain in 1Q23
- $0.2 million gain in 4Q22
- -$1 million cost in 2Q22
- -$4 million in “Other” in the TTM period based on
- $0.2 million gain in 1Q23
- -$1 million expense in 4Q22
- -$2 million expense in 3Q22
- -$1 million expense in 2Q22
- $26 million in marketable and non-marketable investment securities gains in the TTM period based on
- -$0.3 million loss in marketable securities in 1Q23
- $0.3 million loss in marketable securities in 4Q22
- $0.4 million gain in non-marketable securities in 4Q22
- -$0.5 million loss in marketable securities in 3Q22
- $27 million gain in non-marketable securities in 3Q22
- <$0.1 million gain in marketable securities in 2Q22
Tax Distortion = -$0.35/per share, which equals -$220 million
The $1.18/share of Street Distortion in the TTM ended 1Q23 highlights that Core Earnings account for a more comprehensive set of unusual items when calculating DISH Network’s true profitability.
This article was originally published on July 7, 2023.
Disclosure: David Trainer, Kyle Guske II, Hakan Salt, and Italo Mendonça receive no compensation to write about any specific stock, style, or theme.
Questions on this report or others? Join our Society of Intelligent Investors and connect with us directly.
[1] The Journal of Financial Economics features the superiority of our Core Earnings in Core Earnings: New Data & Evidence.
[2] Street Earnings refer to Zacks Earnings, which are reported to remove non-recurring items using standardized assumptions from the sell-side.