While Street Earnings[1] overstate profits for the majority of S&P 500 companies, as shown in Street Earnings Overstated for 74% of S&P 500 in 2Q24, there are many S&P 500 companies whose Street Earnings are lower than their Core Earnings[2].
Picking out the one stock most likely to beat the Street’s estimates for next quarter’s earnings is something only we can do. Without our proprietary footnotes data, all the other analysts are flying blind. They are forced to estimate earnings without the critical gains and charges that companies hide in their footnotes so they can manipulate their earnings.
Every quarter, we comb through thousands of footnotes to find the one stock we think is most likely to beat the Street. We think this stock will beat because their Street Earnings are artificially depressed by non-operating expenses that we remove when we calculate our proven-superior Core Earnings.
You probably won’t be surprised to learn that Street Earnings overstate profits for the majority of S&P 500 companies. There are far fewer S&P 500 companies whose Street Earnings are lower than their Core Earnings.
Today, we’re featuring the first of our two earnings season preview reports. This report shows:
- the frequency and magnitude of understated Street Earnings in the S&P 500 and
- the S&P 500 company most likely to beat 3Q24 earnings.
Our Robo-Analyst allows us to compare Core Earnings across the entire market.
Street EPS Are Lower Than Core EPS for 121 S&P 500 Companies
For 121 companies in the S&P 500, or 24%, Street Earnings are lower than Core Earnings in the trailing-twelve-months (TTM) ended 2Q24. In the TTM ended 1Q24, Street Earnings were understated for 122 companies.
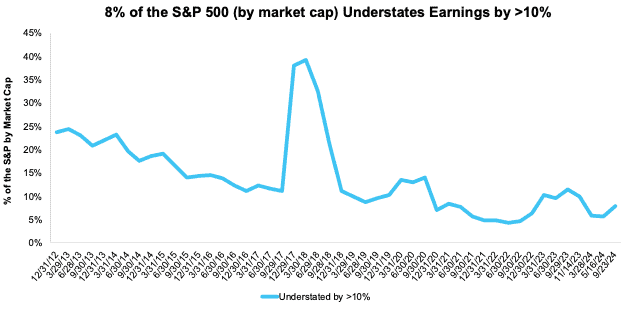
The percentage of the S&P 500 where Street Earnings understate Core Earnings by more than 10% equals 9% (43 companies) in 2Q24, which is up from 41 companies in the TTM ended 1Q24.
Those 43 companies make up 8% of the market cap of the S&P 500 as of 9/23/24, which is up from 6% of the market cap in 1Q24, measured with TTM data in each quarter. See Figure 1.
Figure 1: Understated Street Earnings by >10% as % of Market Cap: 2012 through 9/23/24
Sources: New Constructs, LLC and company filings.
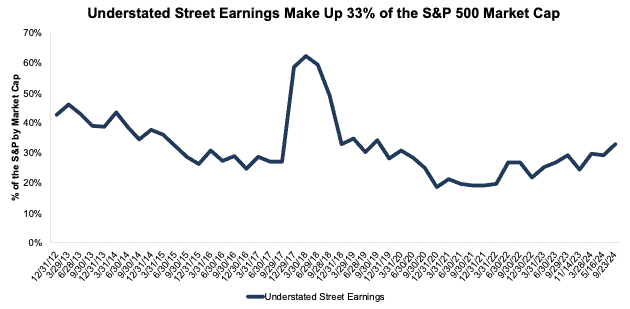
The 121 companies with understated (by any amount) Street Earnings represent 33% of the market cap of the S&P 500 as of 9/23/24, which is up from 29% in the TTM ended 1Q24. See Figure 2.
Figure 2: Understated Street Earnings as % of Market Cap: 2012 through 9/23/24
Sources: New Constructs, LLC and company filings.
Note that this analysis is based on our team analyzing the financial statements and footnotes for ~3,000 10-Ks and 10-Qs filed with the SEC after earnings season. We estimate that the cost of this work for most firms would be over $2 million each quarter. To say the least, there is tremendous value in our rigorous analysis of these filings across so many companies so that our clients can discern the best and worst stocks with unrivaled diligence.
When Street Earnings are lower than Core Earnings, they are understated by an average of 24%, per Figure 3.
Figure 3: Street Earnings Understated by 24% on Average in TTM Through 2Q24
Sources: New Constructs, LLC and company filings.
S&P 500 Company Most Likely to Beat Calendar 3Q24 Earnings
Figure 4 shows the S&P 500 company with a Strong Beat Earnings Distortion Score likely to beat calendar 3Q24 earnings because their Street EPS estimates are understated. Because investors and analysts tend to anchor their earnings projections to historical results, errors in historical Street EPS lead to errors in Street EPS estimates.
Figure 4: S&P 500 Company Likely to Beat 3Q24 EPS Estimates
Sources: New Constructs, LLC, company filings, and Zacks
*Assumes Street Distortion as a percentage of Core EPS is the same in 3Q24 as the TTM ended 2Q24
This article was originally published on September 25, 2024.
Disclosure: David Trainer, Kyle Guske II, and Hakan Salt receive no compensation to write about any specific stock, style, or theme.
Questions on this report or others? Join our online community and connect with us directly.
[1] Street Earnings refer to Zacks Earnings, which are adjusted to remove non-recurring items using standardized sell-side assumptions.
[2] The Journal of Financial Economics features the superiority of our Core Earnings in Core Earnings: New Data & Evidence.


