
Wall Street analysts are too bullish on fourth quarter earnings expectations for most S&P 500 companies. In fact, the percent of companies that overstate earnings is at its highest point since 2012 (earliest data available), which increases the likelihood of misses in the upcoming earnings season.
This report shows:
- the prevalence and magnitude of overstated Street Earnings[1] in the S&P 500
- five S&P 500 companies with overstated Street estimates likely to miss 4Q21 earnings
- how Core Earnings[2] and our Earnings Distortion factor provide a new source of alpha.
Get our report on the S&P 500 companies more likely to beat 4Q21 Street EPS estimates here.
Street Overstates EPS for 360 S&P 500 Companies – Most Since 2012
Over the trailing twelve-months (TTM) the 360 companies with overstated Street Earnings make up 81% of the market cap of the S&P 500, which is the highest share since 2012. See Figure 1.
Figure 1: Overstated Street Earnings as % of Market Cap: 2012 through 11/16/21
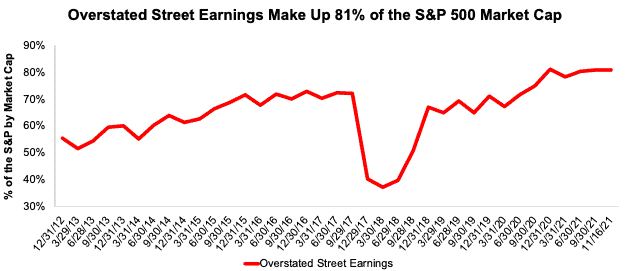
Sources: New Constructs, LLC and company filings.
When Street Earnings overstate Core Earnings[3], they do so by an average of 19% per company, per Figure 2. The overstatement was more than 10% of Street Earnings for 39% of companies.
Figure 2: S&P 500 Street Earnings Overstated by 19% on Average Through 3Q21[4]

Sources: New Constructs, LLC and company filings.
Five S&P 500 Companies Likely to Miss Calendar 4Q21 Earnings
Figure 3 shows five S&P 500 companies likely to miss calendar 4Q21 earnings based on overstated Street EPS estimates. Below we detail the hidden and reported unusual items that have created Street Distortion, and overstated Street Earnings, over the TTM for Valero Energy (VLO). Contact us for the same details on the other companies.
Figure 3: Five S&P 500 Companies Likely to Miss 4Q21 EPS Estimates
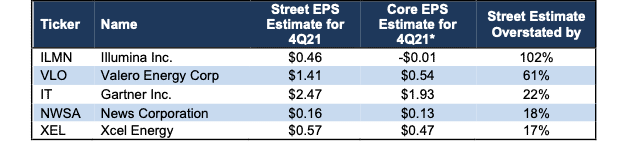
Sources: New Constructs, LLC, company filings, and Zacks
*Assumes Street Distortion as a percent of Core EPS is same for 4Q21 EPS as for TTM ended 3Q21.
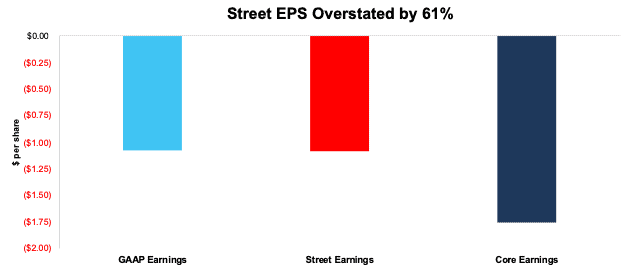
Valero Energy: The Street Overstates Earnings for 4Q21 by $0.87/share
The Street’s 4Q21 EPS estimate of $1.41/share for Valero Energy is overstated by $0.87/share due, at least in part, to large gains on foreign currency contracts reported in “Other Income” that are included in historical EPS.
Our Core EPS estimate is $0.54/share, which makes Valero one of the companies most likely to miss Wall Street analyst’s expectations in its 4Q21 earnings report. Valero Energy’s Earnings Distortion Score is Miss and its Stock Rating is Unattractive.
Unusual gains, which we detail below, materially increased Valero Energy’s 3Q21 TTM Street and GAAP earnings and makes profits look better than Core EPS. When we adjust for all unusual items, we find that Valero Energy’s 3Q21 TTM Core EPS are -$1.76/share, which is worse than 3Q21 TTM Street EPS of -$1.09/share and 3Q21 TTM GAAP EPS of -$1.08/share.
Figure 4: Comparing Valero Energy’s GAAP, Street, and Core Earnings: TTM as of 3Q21
Sources: New Constructs, LLC and company filings.
Below, we detail the differences between Core Earnings and GAAP Earnings so readers can audit our research. We would be happy to reconcile our Core Earnings with Street Earnings but cannot because we do not have the details on how analysts calculate their Street Earnings.
Figure 5 details the differences between Valero Energy’s Core Earnings and GAAP Earnings.
Figure 5: Valero Energy’s GAAP Earnings to Core Earnings Reconciliation: 3Q21

Sources: New Constructs, LLC and company filings.
More details:
Total Earnings Distortion of $0.68/share is comprised of the following:
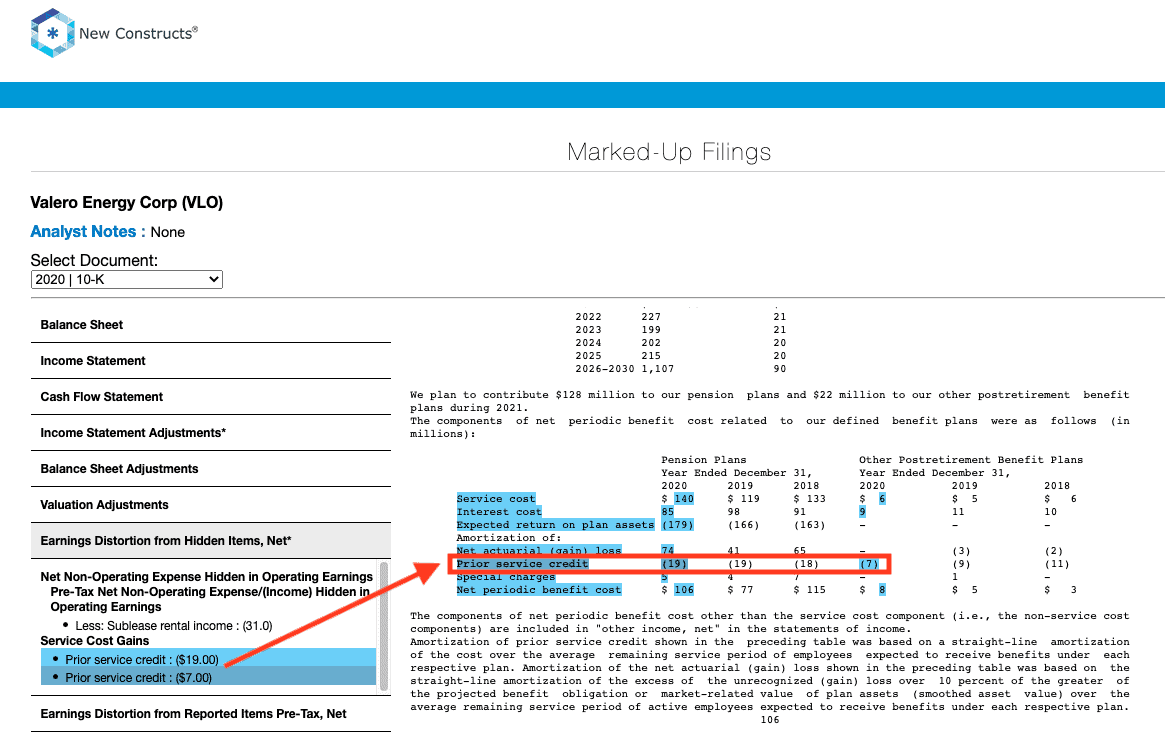
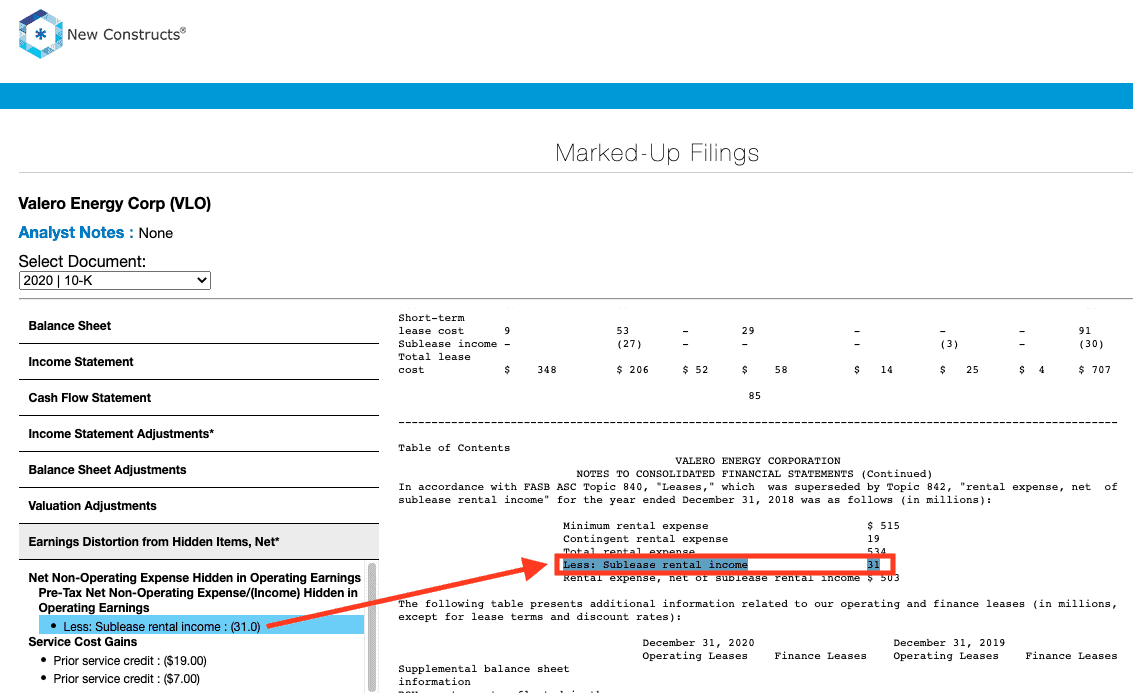
Hidden Unusual Gains, Net = $0.08/per share, which equals $33 million and is comprised of
- $26 million in prior service credits in the TTM period based on $26 million reported in the 2020 10-K
- $7 million in the TTM period based on $31 million in sublease rental income in the 2020 10-K.
Reported Unusual Gains Pre-Tax, Net = $0.44/per share, which equals $178 million and is comprised of
- $204 million in “Other Income"[5] in the TTM period based on
- $32 million in 3Q21
- $102 million in 2Q21
- $45 million in 1Q21
- $25 million in 4Q20
- $26 million contra adjustment for recurring pension costs. These recurring expenses are reported in non-recurring line items, so we add them back and exclude them from Earnings Distortion.
Tax Distortion = $0.16/per share, which equals $66 million
- We remove the tax impact of unusual items on reported taxes when we calculate Core Earnings. It is important that taxes get adjusted so they are appropriate for adjusted pre-tax earnings.
Reported Unusual Expenses After-Tax, Net = -$0.01/per share, which equals -$3 million and is comprised of
- -$3 million in income allocated to participating securities in the TTM period based on
- -$1 million in income in 3Q21
- -$2 million in income in 2Q21
- -$1 million in income in 1Q21
- $1 million in expense in 4Q20
Given the similarities between Street Earnings for Valero Energy and GAAP Earnings, our research shows both Street and GAAP earnings fail to capture significant unusual items in Valero Energy’s financial statements.
How to Make Money with Core Earnings & Earnings Distortion
As demonstrated above, Core Earnings do a better job of excluding unusual gains and losses and provide a more reliable earnings measure. All Core Earnings adjustments are 100% transparent; so users can audit and trust the research.
To enable you to easily monetize our new Earnings Distortion factor we present multiple trading strategies that drive alpha. Learn more below.
- ExtractAlpha presents a long/short market-neutral strategy that generates 9.3% annualized return net of Fama-French 5 factors, momentum, short-term reversal, and 12 sectors. More details here.
- CloudQuant presents two strategies to monetize the alpha in Earnings Distortion:
- the long-only portfolio outperformed the S&P 500 by an average of 4% per annum over 10 years
- the dollar-neutral long-short portfolio returned 60% over 10 years with a Sharpe Ratio of ~1 over the last five years. More details here.
- AltHub presents three strategies to monetize the alpha in Earnings Distortion:
- Earnings Distortion S&P 500 Smart Beta Portfolio: 10-yr annualized return of 13.9% vs 12.1% for the S&P 500 with a Sharpe Ratio of 0.97.
- Earnings Distortion ML Model S&P 500 Smart Beta Portfolio: 3-yr annualized return of 18.2% vs 13.7% for the S&P 500 with a Sharpe Ratio of 0.82.
- Truth Stocks (Companies without Earnings Distortion) Portfolios:
- S&P 500 Universe: 10-yr annualized return of 16.8% vs 12.8% for the S&P 500 with a Sharpe Ratio of 0.7.
- Russell 3000 Universe: 9.5-yr annualized return of 28.4% vs 12.6% for the S&P 500 with a Sharpe Ratio of 1.
- More details here.
This article originally published on January 10, 2022.
Disclosure: David Trainer, Kyle Guske II, and Matt Shuler receive no compensation to write about any specific stock, style, or theme.
Follow us on Twitter, Facebook, LinkedIn, and StockTwits for real-time alerts on all our research.
[1] Street Earnings refer to Zacks Earnings, which are adjusted to remove non-recurring items using standardized assumptions from the sell-side.
[2] Only Core Earnings enable investors to overcome the flaws in legacy fundamental data and research, as proven in Core Earnings: New Data & Evidence, written by professors at Harvard Business School (HBS) & MIT Sloan for The Journal of Financial Economics.
[3] Our Core Earnings research is based on the latest audited financial data, which is the calendar 3Q21 10-Q in most cases
[4] Average overstated % is calculated as Street Distortion, which is the difference between Street Earnings and Core Earnings.
[5] Valero Energy reports Other Income directly on the Income Statement but provides additional details in the footnotes of its financial filings. For instance, in 2Q21, Other Income includes, among other items, a $53 million gain due to foreign currency contract derivatives and a $62 million gain on the sale of a 24.99% membership interest in MVP.