During 4Q24 Footnotes Season (February 11 – March 15), our Robo-Analyst collected 264,431 data points. This data led to 38,492 Core Earnings, balance sheet, and valuation adjustments with a combined dollar value of $21.8 trillion. The adjustments were applied as follows:
- 15,652 income statement adjustments with a total value of $1.3 trillion
- 14,905 balance sheet adjustments with a total value of $9.0 trillion
- 7,935 valuation adjustments with a total value of $11.5 trillion
Figure 1: Footnote Diligence for 2024 10-K Footnotes Season: Feb-Mar 2025
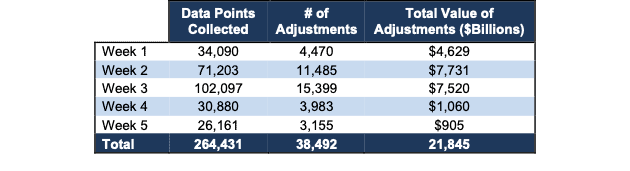
Sources: New Constructs, LLC and company filings.
This diligence created $2,106,000 of value for clients. See Figure 2.
Footnotes Seasons give our Robo-Analyst technology[1] an opportunity to shine as it enables us to produce proven-superior research with unrivaled speed and scale. Every year from mid-February through early March, we parse and analyze over 2,000 10-Ks and 10-Qs to update our models for companies with 12/31 and 1/31 fiscal year ends.
Figure 2: Putting a $ Value on Our Parsing Work for Clients: 4Q24 Footnotes Season
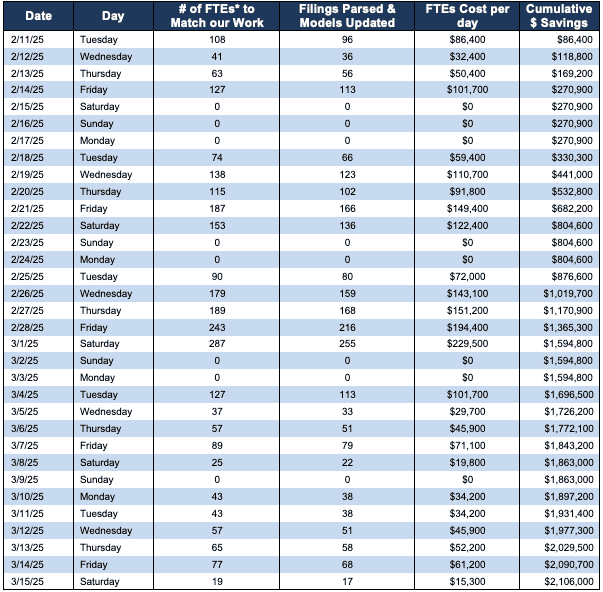
Sources: New Constructs, LLC
* FTEs = Full Time Employees at $100/hour for 8 hours a day.
Indeed, the work we do during footnotes season would cost our clients multiples more time and money than what we charge to replicate what we deliver.
The savings in Figure 2 are likely very conservative estimates because they do not account for the cost of any management or training of analysts. Nor, do they count the cost of building the financial models to house the data or tracking accounting rule changes to make sure those models remain accurate.
Even with these conservative assumptions, it is clear that we create tremendous value for all of our clients, from Stock Tracker 50 to Professional and Institutional members.
Want access to our superior fundamental research? Start your membership today.
Proprietary Footnotes Data Drives Alpha
While we’re explaining the diligence required to calculate Core Earnings and generate proven-superior Stock Ratings, we want to show you how both deliver alpha. We’ve developed multiple indices for tracking the performance of portfolio strategies based on Core Earnings and our Stock Ratings. All are outperforming the S&P 500 this year. See Figures 3 and 4.
Figure 3 compares the performance of the Very Attractive Stocks Index, managed by Bloomberg, to the S&P 500. In 1Q25, the Bloomberg New Constructs Ratings VA-1Index (ticker: BNCVAT1T:IND) was up 4.6% while the S&P 500 was down 4.6%.
Figure 3: Very Attractive-Rated Stocks Strongly Outperform the S&P 500 in 1Q25
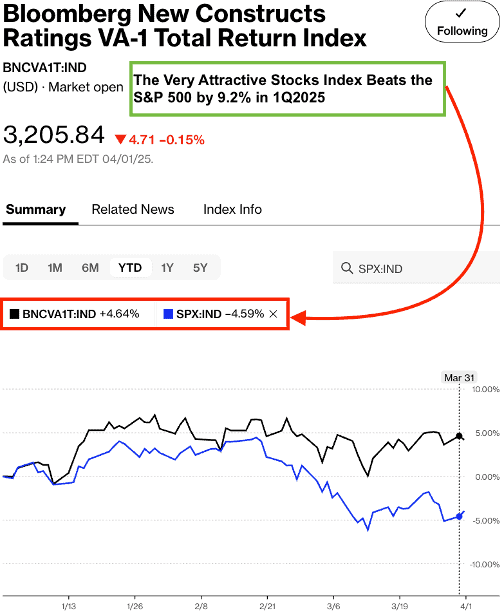
Sources: Bloomberg
Note: Past performance is no guarantee of future results.
Figure 4 compares the performance of the Bloomberg New Constructs 500 Total Return Index, managed by Bloomberg, to the S&P 500. In 1Q25, the Bloomberg New Constructs 500 Total Return Index (ticker: BNCVAT1T:IND) was down 3.6% while the S&P 500 was down 4.6%.
Figure 4: Bloomberg New Constructs 500 Index Strongly Outperforms the S&P 500 in 1Q25
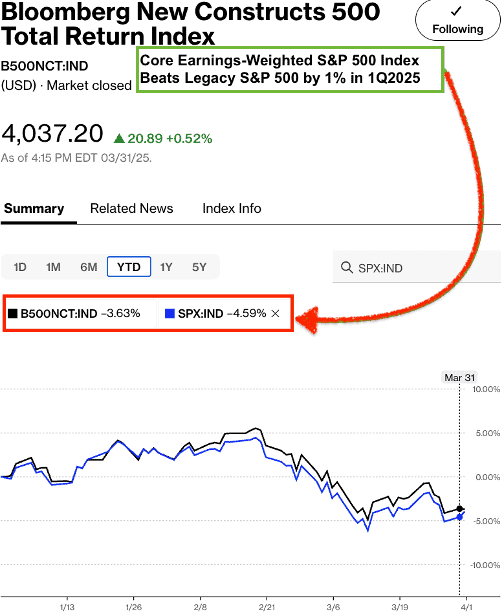
Sources: Bloomberg
Note: Past performance is no guarantee of future results.
This article was originally published on April 4, 2025.
Disclosure: David Trainer, Kyle Guske II, and Hakan Salt receive no compensation to write about any specific stock, sector, style, or theme.
Questions on this report or others? Join our online community and connect with us directly.
[1] Harvard Business School features the powerful impact of our research automation technology in New Constructs: Disrupting Fundamental Analysis with Robo-Analysts.