
After Dick’s Sporting Goods announced its plan to purchase Foot Locker in a $2.4 billion deal, the stocks moved in opposite directions. Foot Locker’s shares surged 85%, while Dick’s stock declined by 14%. The price movements elicit both euphoria, a retailer has been “saved,” and concern over the risk of acquiring a struggling retailer.
Unexpected events cause stocks to move in unpredictable ways, which is why our investment philosophy shuns speculating. Instead, we employ a data-driven fundamental approach, anchored in math and logic.
Rather than guessing, we quantify the cash flow assumptions embedded in a stock’s price. Our reverse discounted cash flow (DCF) model distills stock prices into specific revenue growth, ROIC and competitive advantage period expectations that we compare to past performance. This framework allows us to evaluate whether a stock is priced appropriately, based on data not narrative.
Our Most Attractive Stocks Model Portfolio identifies stocks that are not only undervalued but also possess strong fundamentals. To demonstrate how our superior research creates alpha, we are sharing a free stock pick from this Model Portfolio.
This pick comes with a concise summary, not a full Long Idea report. The summary gives you insight into the rigor of our research and approach to picking stocks. Whether you’re a subscriber or not, we think it is important, especially in today’s volatile market environment, that you’re able to see our research on stocks. We’re proud to share our work, and we want to help investors when they need it most.
Keep an eye out for the free pick from our Most Dangerous Stocks Model Portfolio, which will be published this week as well! Stock picking success, like golf, is as much about how well you hit your bad shots as how well you hit your good shots!
We hope you enjoy this research. Feel free to share with friends and colleagues!
We update this Model Portfolio monthly. The latest Most Attractive and Most Dangerous stocks Model Portfolios were updated and published for clients on May 6, 2025.
Free Most Attractive Stocks Pick: Cal-Maine Foods, Inc. (CALM)
Cal-Maine Foods (CALM: $94/share) has grown revenue and net operating profit after tax (NOPAT) by 9% and 23% compounded annually since fiscal 2014, respectively. Cal-Maine Foods’ NOPAT margin increased from 7% in fiscal 2014 to 25% in the TTM, while its invested capital turns remained steady at 2.6 over the same time. Rising NOPAT margins and consistent invested capital turns drive Cal-Maine Foods’ return on invested capital (ROIC) from 18% in fiscal 2014 to 65% in the TTM.
Figure 1: Cal-Maine Foods’ Revenue and NOPAT Since Fiscal 2014
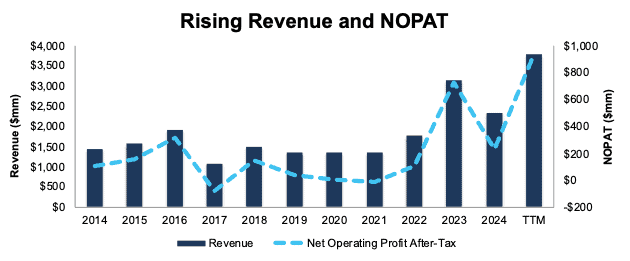
Sources: New Constructs, LLC and company filings
CALM Is Undervalued
At its current price of $94/share, CALM has a price-to-economic book value (PEBV) ratio of 0.3. This ratio means the market expects Cal-Maine Foods’ NOPAT to permanently decline by 70% from TTM levels. This expectation seems overly pessimistic for a company that has grown NOPAT by 23% compounded annually over the last decade and 13% compounded annually over the last two decades.
Even if Cal-Maine Foods’ NOPAT margin falls to 12% (less than half TTM NOPAT margin of 25%) and the company grows revenue by just 2% (below ten-year compound annual growth rate of 9%) compounded annually through 2034, the stock would be worth $123/share today – a 31% upside. In this scenario, Cal-Maine Foods’ NOPAT would grow just 4% compounded annually through 2034. Contact us for the math behind this reverse DCF scenario.
Should Cal-Maine Foods grow profits more in line with historical levels, the stock has even more upside.
Critical Details Found in Financial Filings by Our Robo-Analyst Technology
Below are specifics on the adjustments we made based on Robo-Analyst findings in Cal-Maine Foods’ 10-K and 10-Q:
Income Statement: we made under $100 million in adjustments, with a net effect of removing over $50 million in non-operating income. Professional members can see all adjustments made to the company’s income statement on the GAAP Reconciliation tab on the Ratings page on our website.
Balance Sheet: we made over $700 million in adjustments to calculate invested capital with a net decrease of just under $700 million. One of the most notable adjustments was for asset write downs. Professional members can see all adjustments made to the company’s balance sheet on the GAAP Reconciliation tab on the Ratings page on our website.
Valuation: we made over $1 billion in adjustments to shareholder value, with a net increase of just over $1 billion. The most notable adjustment was for excess cash. Professional members can see all adjustments to the company’s valuation on the GAAP Reconciliation tab on the Ratings page on our website.
This article was originally published on May 16, 2025.
Disclosure: David Trainer, Kyle Guske II, and Hakan Salt receive no compensation to write about any specific stock, style, or theme.
Questions on this report or others? Join our online community and connect with us directly.