
Incentives play a critical role in shaping behavior. When a company ties executive compensation to revenue growth or flawed metrics like adjusted EBITDA, it’s only natural that executives will prioritize those targets.
However, growing revenue or adjusted EBITDA without regard for real profits undermines the company’s long-term financial health. It also destroys shareholder value.
We think that the board of directors for more publicly-traded companies should tie executive compensation to metrics that drive shareholder value creation. There is no better metric for this purpose than return on invested capital (ROIC). Linking executive compensation to ROIC aligns the interests of the executives with those of the shareholders.
Our Exec Comp Aligned with ROIC Model Portfolio includes only those stocks that (1) receive an Attractive-or-better rating and (2) directly link executive compensation to ROIC. We believe this combination signals disciplined capital allocation and strong upside potential.
We are proud to offer the Exec Comp Aligned with ROIC Model Portfolio, and we are excited to give you a free stock pick from this Model Portfolio.
The goal behind sharing these free stock picks with you is to deliver insight into the uniquely high value-add of our research. We want you to know how hard we work and how we do research, so you know what you should expect from a good research provider and how real AI works.
We update this Model Portfolio monthly, and July’s Exec Comp Aligned with ROIC Model Portfolio was updated and published for clients on July 16, 2025.
Free Stock Pick for July: John B. Sanfilippo & Son, Inc. (JBSS: $68/share)
John B. Sanfilippo has grown revenue and net operating profit after tax (NOPAT) by 3% and 9% compounded annually since fiscal 2014, respectively. The company’s NOPAT margin improved from 3% in fiscal 2014 to 6% in the TTM and invested capital turns increased from 2.4 to 2.5 over the same time. Rising NOPAT margins and invested capital turns drive the company’s return on invested capital (ROIC) from 8% in fiscal 2014 to 14% in the TTM.
Figure 1: John B. Sanfilippo’s Revenue & NOPAT: Fiscal 2014 – TTM
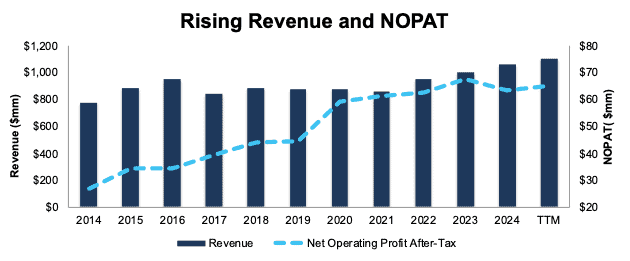
Sources: New Constructs, LLC and company filings
Executive Compensation Properly Aligns Incentives
John B. Sanfilippo’s executive compensation plan aligns the interests of executives and shareholders by tying its annual bonus awards to a “Return on Capital/economic value added” model which, according to the company’s proxy statement, the company calls the Sanfilippo-Value Added plan. Under the plan, executives are rewarded for year-over-year improvement in economic profit.
The company’s inclusion of economic profit targets, which are similar to our economic earnings, has helped create shareholder value by driving higher ROIC and economic earnings. When we calculate ROIC using our superior fundamental data, we find that John B. Sanfilippo’s ROIC has increased from 8% in fiscal 2014 to 14% in the TTM.
Economic earnings rose from $15 million to $37 million over the same time. See Figure 2.
Figure 2: John B. Sanfilippo’s Economic Earnings: Fiscal 2014 – TTM
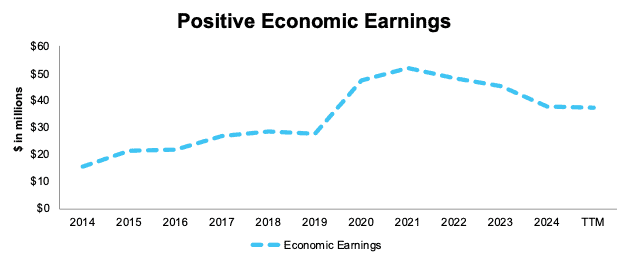
Sources: New Constructs, LLC and company filings
JBSS Has Further Upside
At its current price of $68/share, JBSS has a price-to-economic book value (PEBV) ratio of 0.9. This ratio means the market expects John B. Sanfilippo’s NOPAT to permanently fall 10% from current levels. This expectation seems overly pessimistic for a company that has grown NOPAT 7% and 9% compounded annually over the last five and ten years, respectively.
Even if John B. Sanfilippo’s:
- NOPAT margin falls to 5% (below five-year average of 7% and TTM NOPAT margin of 6%) through 2034, and
- revenue grows just 4% (equal to CAGR over the last five years) compounded annually through 2034 then,
the stock would be worth $87/share today – a 28% upside. Contact us for the math behind this reverse DCF scenario. In this scenario, John B. Sanfilippo’s NOPAT would grow just 2% compounded annually from 2025 through 2034.
Should the company grow NOPAT more in line with historical growth rates, the stock has even more upside.
Critical Details Found in Financial Filings by Our Robo-Analyst Technology
Below are specifics on the adjustments we made based on Robo-Analyst findings in John B. Sanfilippo’s 10-K and 10-Qs:
Income Statement: we made under $15 million in adjustments with a net effect of removing under $5 million in non-operating expense. Professional members can see all adjustments made to the company’s income statement on the GAAP Reconciliation tab on the Ratings page on our website.
Balance Sheet: we made under $100 million in adjustments to calculate invested capital with a net decrease of under $10 million. One of the most notable adjustments was for asset write downs. Professional members can see all adjustments made to the company’s balance sheet on the GAAP Reconciliation tab on the Ratings page on our website.
Valuation: we made over $150 million in adjustments, all of which decreased shareholder value. The most notable adjustment to shareholder value was total debt. Professional members can see all adjustments to the company’s valuation on the GAAP Reconciliation tab on the Ratings page on our website.
This article was originally published on July 28, 2025.
Disclosure: Kyle Guske II owns JBSS. David Trainer, Kyle Guske II, and Hakan Salt receive no compensation to write about any specific stock, style, or theme.
Questions on this report or others? Join our online community and connect with us directly.