
Opendoor’s (OPEN) recent sharp rally, which followed a CEO change, highlights the ongoing volatility in today’s market. Despite persistent operational and financial headwinds, the appointment of a new CEO and the return of the co-founders to the board triggered a surge of more than 50% in a single day.
Even though meme stock runs have diminished in magnitude relative to 2021, OPEN once again proves that momentum and sentiment reign supreme, at least in the short term. However, as we’ve seen in the past, when the hype dies down, sharp corrections follow.
For investors who want to avoid these volatile and overvalued stocks, we created the Most Dangerous Stocks Model Portfolio. This Model Portfolio highlights the worst of the worst, the stocks with poor fundamentals and excessive valuations, so you can avoid them with confidence. To illustrate the level of risk these stocks present, we are featuring a stock from this Model Portfolio.
This free stock feature provides a summary of how we pick stocks for this Model Portfolio. It is not a full Danger Zone report, but it provides insight into the rigor of our research and approach to picking stocks. Whether you’re a subscriber or not, we think it is important that you’re able to see our research on stocks on a regular basis.
We’re proud to share our work. Please feel free to share it with your friends and family.
Keep an eye out for the free pick from our Most Attractive Stocks Model Portfolio, which will be published this week as well! The work that goes into that report is just as valuable.
We update this Model Portfolio monthly. The latest Most Attractive and Most Dangerous stocks Model Portfolios were updated and published for clients on September 4, 2025.
Free Most Dangerous Stock Pick: PRA Group Inc. (PRAA)
PRA Group’s (PRAA: $17/share) net operating profit after tax (NOPAT) margin fell from 20% in 2019 to 9% in the TTM, while the company’s invested capital turns fell from 0.3 to 0.2 over the same time. Falling NOPAT margins and invested capital turns drive PRA Group’s return on invested capital (ROIC) from 5% in 2019 to 2% in the TTM.
PRA Group’s economic earnings, the true cash flows of the business, fell from -$167 million in 2019 to -$400 million in the TTM. Meanwhile, the company’s GAAP net income rose from $86 million to $92 million over the same time. Whenever GAAP earnings rise while economic earnings decline, investors should beware.
Figure 1: PRA Group’s Economic vs GAAP Earnings Since 2019
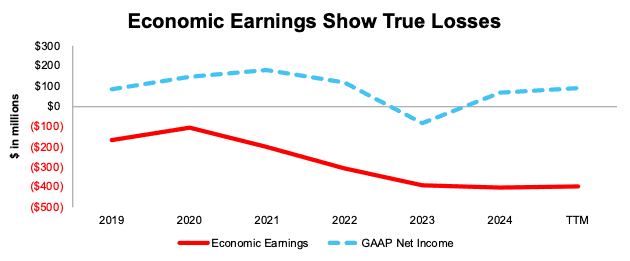
Sources: New Constructs, LLC and company filings
PRAA Provides Poor Risk/Reward
Despite its poor and declining fundamentals, PRA Group’s stock is priced for significant profit growth, and we believe the stock is overvalued.
To justify its current price of $17/share, PRA Group must immediately improve its NOPAT margin to 33% (equal to the company’s record margin in 2002 and above its 9% margin in the TTM) and grow revenue by 5% compounded annually through 2034 (compared to five- and ten-year CAGR of -2% and <1%, respectively). In this scenario, PRA Group’s NOPAT would grow 20% compounded annually through 2034. For reference, PRA Group’s NOPAT has fallen by 16% and 9% compounded annually over the last five and ten years, respectively. Contact us for the math behind this reverse DCF scenario. We think these expectations look overly optimistic.
Even if PRA Group improves its NOPAT margin to 33% and grows revenue 4% compounded annually through 2034, the stock would be worth no more than $9/share today – a 47% downside to the current stock price. Contact us for the math behind this reverse DCF scenario.
Each of these scenarios also assumes PRA Group can grow revenue, NOPAT, and FCF without increasing working capital or fixed assets. This assumption is unlikely but allows us to create best case scenarios that demonstrate the high expectations embedded in the current valuation.
Critical Details Found in Financial Filings by Our Robo-Analyst Technology
Below are specifics on the adjustments we made based on Robo-Analyst findings in PRA Group’s 10-K and 10-Q:
Income Statement: we made just over $500 million in adjustments, with a net effect of removing under $25 million in non-operating expense. Professional members can see all adjustments made to the company’s income statement on the GAAP Reconciliation tab on the Ratings page on our website.
Balance Sheet: we made just over $900 million in adjustments to calculate invested capital with a net increase of under $50 million. One of the most notable adjustments was for other comprehensive income. Professional members can see all adjustments made to the company’s balance sheet on the GAAP Reconciliation tab on the Ratings page on our website.
Valuation: we made nearly $3.9 billion in adjustments to shareholder value, with a net decrease of under $3.6 billion. The most notable adjustment to shareholder value was for total debt. Professional members can see all adjustments to the company’s valuation on the GAAP Reconciliation tab on the Ratings page on our website.
This article was originally published on September 12, 2025.
Disclosure: David Trainer, Kyle Guske II, and Hakan Salt receive no compensation to write about any specific stock, style, or theme.
Questions on this report or others? Join our online community and connect with us directly.