
When American Eagle (AEO) launched its jeans campaign with actress Sydney Sweeney, the initial reaction was largely critical, with skeptics finding something to criticize at every opportunity. Yet, like the adage, no publicity is bad publicity, as the results speak for themselves.
The collaboration, initially labeled as “controversial”, delivered a significant uplift in American Eagle’s sales, driving the stock up more than 35% in a single trading day. What began as skepticism became a clear example of how strategic brand initiatives can translate into meaningful shareholder value.
In an increasingly discerning market, companies with strong businesses get rewarded. By leveraging our AI Agent for investing, we take it a step further by identifying quality companies that also have good stocks, and we highlight the best of those stocks in our Long Idea reports.
Our Long Idea this week features a company that benefits from strong macro tailwinds in its industry, has a low-cost advantage driven by its superior technology, and, best of all, its stock price looks cheap.
With the rise in e-brokerages, access to capital markets and investing has never been greater. The clear winners, apart from investors, are the brokerage companies themselves. This e-brokerage company has a unique market leader position and is poised to capitalize on growth for years to come. Interactive Brokers (IBKR: $64/share) is this week’s Long Idea.
We first unveiled IBKR as a Super Stock in September 2024. Super Stocks offer a very rare combination of qualities. They (1) earn a Very Attractive rating and (2) have businesses that generate economic earnings greater than GAAP earnings. Most importantly, Super Stocks outperform. For example, IBKR is up an impressive 94%, compared to the S&P 500 rising 14%, since we unveiled it as a Super Stock. Even after this strong outperformance, IBKR looks undervalued and offers further upside potential.
IBKR offers favorable Risk/Reward based on the company’s:
- strong macro tailwinds from growing markets for e-brokerage and retail investors,
- low-cost advantage driven by superior technology,
- growing revenues and profits, and
- cheap stock valuation.
Macro Tailwinds: E-Brokerage Market is Expanding
Rising retail investor participation, enabled by accessible and low-cost trading models, has reshaped the investment landscape. Technological innovation also plays a key role: mobile-first platforms with intuitive, gamified features attract new investors, while advanced tools that automate and accelerate processes support more experienced market participants and institutions. At the same time, consumer preferences are shifting decisively toward digital platforms that are easy to use, affordable, and highly automated, which positions the market for sustained expansion.
Research and Markets forecasts the e-brokerage market will grow from $14.1 billion in 2024 to $34.6 billion in 2034, a CAGR of 9.4%.
Figure 1: E-Brokerage Market Growth Forecast: 2024 – 2034
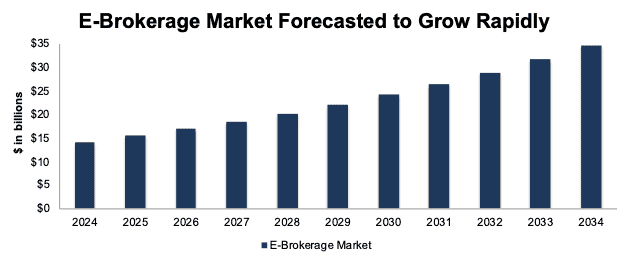
Sources: New Constructs, LLC and company filings
Macro Tailwinds: Number of Individual Investors Continues to Rise
The Covid-19 pandemic marked a significant inflection point in retail investor activity. With increased time at home, limited alternative investment outlets, and heightened market volatility, millions of individuals turned to e-brokerage platforms as a primary means of accessing financial markets.
At the time, market analysts thought the trend might prove transitory, but evidence indicates that retail stock trading has not only persisted but continues to grow. The accessibility of low-cost trading platforms, the democratization of financial information through digital channels, and a generational shift toward active investing have all contributed to sustained growth.
So far in 2025, retail investors account for approximately 21% of daily trading volume on the Nasdaq, compared to just 10% in 2020.
This trend serves as one of the primary tailwinds behind the expansion of the e-brokerage market.
Looking ahead, demographic factors further support an upward trajectory. Younger cohorts, particularly millennials and Gen Z, are entering their peak income and savings years with a stronger predisposition toward direct market engagement and are more technologically savvy than previous generations.
The growing interest of younger generations in capital markets is likely to benefit retail-focused, entry-level investment platforms, such as Robinhood (HOOD) and Webull (BULL), given their emphasis on simplicity and accessibility. However, as these investors gain experience and develop a deeper understanding of market strategies, their preferences are likely to shift toward platforms that provide more advanced tools and sophisticated capabilities, such as Interactive Brokers.
Growing Customer Equity, User Base, and Trade Volumes
Interactive Brokers is capitalizing on the macro tailwinds buffeting its industry.
The company’s customer equity (the total value of all assets held by customers) increased 26% compounded annually over the last decade, from $56.7 billion in 2014 to $664.6 billion in 2Q25.
Interactive Brokers ability to grow customer equity comes not only from rising account balances of existing users, but also attracting new users.
The company’s total accounts grew from 281 thousand in 2014 to 3.9 million at the end of 2Q25. The total accounts grew 37% and 28% compounded annually over the last 5- and 10-years, respectively. See Figure 2.
Figure 2: Interactive Brokers’ Total Accounts: 2014 – 2Q25
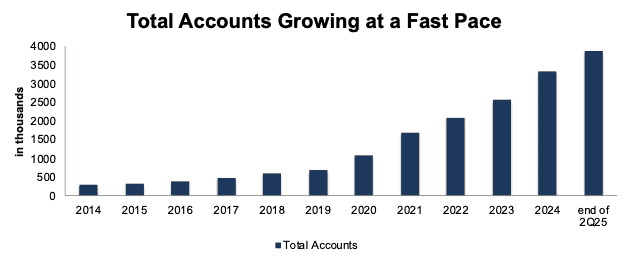
Sources: New Constructs, LLC and company filings
As a result, the company’s total customer daily average revenue trades (DARTs) increased from 564 thousand in 2014 to 3.6 million at the end of 2Q25.
More importantly, Interactive Brokers’ total executed order volumes increased from 289 million in 2014 to 346 million in 2019 to 725 million in 2024. In the first half of 2025 alone, total executed order volumes reached 488 million. Should trade volumes maintain at this rate, the company would execute 976 million orders in 2025, which would be 6% higher than 2024. See Figure 3.
Of note, in 2024, the company’s total trade volumes surpassed the previous high set in 2020, when meme-stock activity drove record volumes.
Figure 3: Interactive Brokers’ Total Executed Trade Volumes: 2014 – Annualized 2025
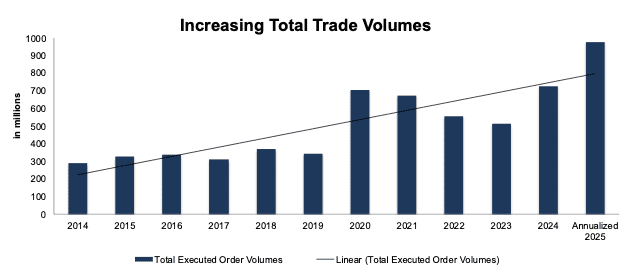
Sources: New Constructs, LLC and company filings
Best-in-Class Offerings
A big driver of Interactive Broker’s strong growth is superior offerings. Interactive Brokers is recognized as one of the industry leaders for its superior pricing, extensive international coverage, wide array of advanced trading tools, and advanced automation.
Interactive Brokers was rated #1 in:
- Best Online Broker for Traders, and one other category, by Forbes in 2024,
- Best Stock Broker for International Trading, by Motley Fool in 2024,
- Best Broker for Advanced Traders, and 5 other categories, by Investopedia in 2025,
- Best Online Broker, and 5 other categories, by BrokerChooser in 2025,
- #1 Professional Trading, and 21 other categories, by StockBrokers.com in 2025, and
- #1 Professional Trading, and 18 other categories, by ForexBrokers.com in 2025.
In the next three sections, we dive into details on the advantages that Interactive Brokers’ superior offerings give its customers.
Advantage 1: Superior Automation with Sophisticated Offerings
Interactive Brokers leverages its proprietary technology to automate the entirety of the transaction lifecycle, which includes account opening, order routing, real-time risk management, securities lending, and regulatory spending. In fact, the majority of the company’s senior management are software engineers, which explains the success and focus on automating as many brokerage processes as possible.
The company’s industry-leading automation enables it to run a low fixed cost and high margin business.
One could argue that, historically, traditional brokerages are against automation, because more client interaction and touch points created more ways to deepen relationships and generate fees for manually performing tasks.
Interactive Brokers took another route and made a big bet on automation. Now the firm is well-positioned to meet the demands and preferences of an increasingly experienced retail trader that prioritizes automation and low costs. We think Interactive Brokers’ bet on automation will continue to pay off for the company and its investors.
Perhaps, most impressive about all this automation is that it supports one of the most sophisticated and flexible investing platforms in the world. Experienced investors consistently choose Interactive Brokers over its competitors because it offers 100+ order types (from limit orders to complex algorithmic trading), prime brokerage services, comprehensive reporting tools, and much more to enhance the investors’ experience.
Advantage 2: Competitive Pricing
Interactive Brokers’ margin loan rates are significantly less than its main competitors, while its interest rate offered on cash balances over $10K is higher. Per Figure 3, Interactive Brokers’ margin loan rate for $25K borrowing is 5.8%, which is significantly lower than the 12.1%, 12.1%, 12.3%, and 12.7% offered by Fidelity, Schwab, Vanguard, and E-Trade, respectively.
Figure 4: Interactive Brokers’ Margin Loan Rates vs Competitors as of June 2025
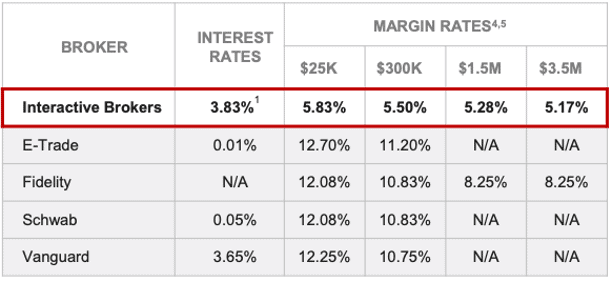
Sources: Interactive Brokers
Advantage 3: More International Coverage
Interactive Brokers facilitates investing and trading on more countries and currencies compared to competitors.
The company offers its financial products in 36 countries and 28 currencies, compared to Fidelity’s 25 countries and 16 currencies and Schwab’s 12 countries and 8 currencies.
Don’t Forget About the Little Guys
Although Interactive Brokers’ clientele is largely sophisticated/high level investors, the company keeps the pipeline of new clients loaded by attracting retail investors with streamlined solutions for beginners.
In fact, the company even offers comprehensive education (IBKR Campus) courses, videos, and webinars for beginners on stocks, ETFs, mutual funds, options trading, fixed income assets, as well as paper trading tools where investors can practice without using/risking real money. IBKR Campus offers a wider variety of education compared to Robinhood’s education offering, Robinhood Learn.
Figure 5: IBKR Campus and Robinhood learn Education Offerings Comparison
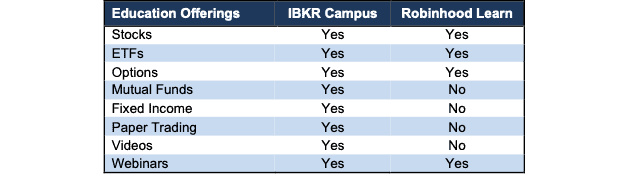
Sources: StockBrokers.com
Consistently Growing Profits
While growing customer accounts, volumes, and assets, Interactive Brokers has also grown its top- and bottom-line. The company has grown revenue and net operating profit after-tax (NOPAT) by 23% and 22% compounded annually since 2014. See Figure 6.
The company’s NOPAT margin fell slightly from 42% in 2014 to 39% in the TTM, while its invested capital turns rose from 0.2 to 0.6 over the same time. Rising invested capital turns drive the company’s return on invested capital (ROIC) from 9% in 2014 to 23% in the TTM.
Additionally, Interactive Brokers’ Core Earnings, a cleaner version of earnings, grew from $45 million in 2014 to $838 million in the TTM, or 32% compounded annually.
Figure 6: Interactive Brokers’ Revenue and NOPAT Since 2014
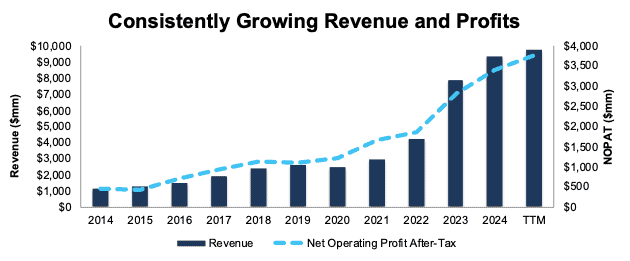
Sources: New Constructs, LLC and company filings
Industry Leading Profitability
On top of being recognized as the best in the industry across multiple categories, Interactive Brokers is also the most profitable brokerage company among publicly-traded competitors.
Interactive Brokers has the highest ROIC and the second highest NOPAT margin among publicly traded peers, which include Robinhood (HOOD), eToro (ETOR), JPMorgan (JPM), Charles Schwab (SCHW), and more. See Figure 7.
Figure 7: Interactive Brokers’ Profitability Vs. Peers: Trailing Twelve Months (TTM)
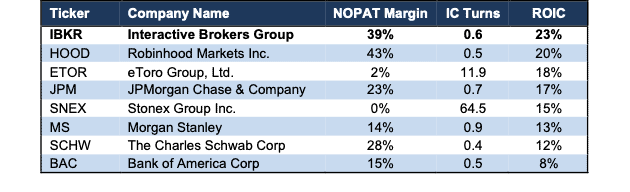
Sources: New Constructs, LLC and company filings
Note: we include Net Interest Income in total revenue for Robinhood because the company does not break out Interest Income and Interest expense. For the other companies, only Interest Income is included in Total Revenue while Interest expense is deducted separately like other operating expenses. As a result, the NOPAT margin for Robinhood is higher than usual, while its Invested Capital Turns are lower. The opposite is true for the other companies in Figure 7. ROIC is the main number on which investors should focus.
Shareholder Return is Minimal
Interactive Brokers does return capital to shareholders through dividends, though the yield is minimal.
Since 2019, Interactive Brokers has paid $337 million (1% of market cap) in cumulative dividends and has increased its quarterly dividend from $0.03/share in 1Q19 to $0.08/share in calendar 3Q25. The company’s current dividend, when annualized, provides a 0.5% yield.
The company hasn’t repurchased any shares over the same time and hasn’t mentioned anything about starting to repurchase shares.
Consistently High Free Cash Flows
Interactive Brokers consistently generates high free cash flow (FCF). Per Figure 8, From 2019 through the first half of 2025, the company generated $2.7 billion in FCF, which equals 6% of the company’s enterprise value.
Figure 8: Interactive Brokers’ Cumulative FCF: 2019 – 1H25
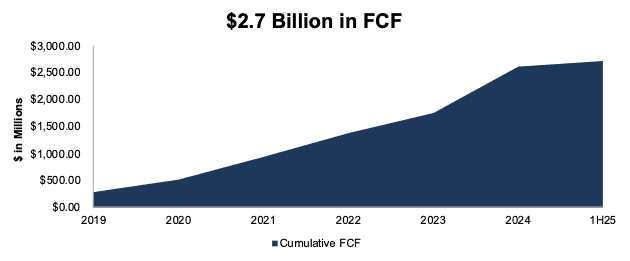
Sources: New Constructs, LLC and company filings
Top-Tier Balance Sheet
Interactive Brokers has the capital strength to weather any uncertainty in the foreseeable future. The company earns a Very Attractive overall Credit Rating and scores an Attractive-or-better rating for all five credit rating criteria. See Figure 9.
Figure 9: Interactive Brokers’ Credit Rating Details
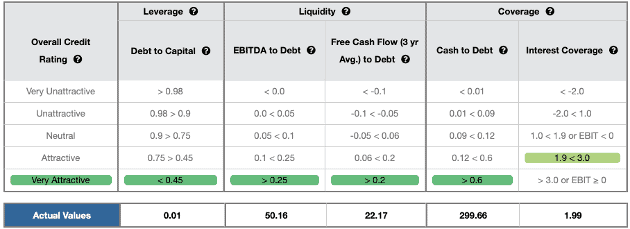
Sources: New Constructs, LLC and company filings
Market Downturn Remains the Biggest Risk
Trade volumes are critical for brokerage companies, so bear markets present unique challenges, more so than short-term volatility.
Analyzing how Interactive Brokers handled prior down markets (2022 and 2008 for instance) gives us an idea of how they might handle one in the future. First, we note that Interactive Brokers remained profitable in both 2008 and 2022, even as the market took a turn for the worst.
How did the company remain profitable while other firms hemorrhaged cash?
- Interactive Brokers’ clientele is more sophisticated/educated than its competitors. These investors are likely to take less risk, be a little more careful and not go bust. They are less likely to abandon trading altogether than less sophisticated traders. In 2008, then CEO Thomas Peterffy noted in the 4Q08 earnings call “we have been very fortunate to have built a sophisticated customer base that remains quite active even in times of severe economic distress.” These words aren’t just management narrative. Interactive Brokers grew total accounts 17% YoY and total DARTs 35% YoY despite the intense market conditions in 2008. The company’s customer equity increased 1% YoY in 2008, while the average customer equity per account fell 13% YoY in 2008. Then CEO Peterffy noted on the earnings call that such performance “is not a surprise in a year when the S&P fell by 38% and it is substantially better than published figures we have seen so far from other brokers.”
- Interactive Brokers’ clients’ volume mix mitigates downside risk in revenues and profits in the event of a market downturn. For example, in 2022’s down market, stock trading volumes fell, but were partially offset by higher futures and options volumes. As a result, the company’s commission revenue fell just 2% YoY in 2022. For comparison, Charles Schwab’s commissions revenue, Morgan Stanley’s commissions and fees revenue, and JPMorgan’s brokerage commissions revenue fell 13%, 11%, and 7% YoY in 2022, respectively.
The company is well-positioned to take market share from big brokers like Schwab and Fidelity due to its lower fees and margin loan rates. Should economic conditions deteriorate, investors and hedge funds, will gravitate towards lower cost offerings, and IBKR offers the lowest.
Lastly, Interactive Brokers’ large asset base provides ample opportunity, throughout nearly all market cycles.
Current Price Implies Margins Deteriorate to Levels Never Seen Before
At its current price of $64/share, IBKR has a price-to-economic book value (PEBV) ratio of 1.0. This ratio means the market expects the company’s NOPAT to never grow from TTM levels. This expectation seems overly pessimistic considering Interactive Brokers has grown NOPAT by 25%, 22% and 14% compounded annually over the past 5, 10, and 15 years, respectively.
Below, we use our reverse discounted cash flow (DCF) model to analyze expectations for different stock price scenarios for IBKR.
In the first scenario, we quantify the expectations baked into the current price. If we assume:
- NOPAT margin falls to 23% (below the company’s lowest ever margin of 30% in 2010) from 2025 through 2034 and
- revenue grows at consensus rates in 2025 (11%), 2026 (7%), and 2027 (7%), and
- revenue grows 7% (continuation of 2027 consensus) each year thereafter through 2034 (below the company’s 5-year CAGR of 27% and 10-year CAGR of 23% compounded annually through 2034), then
IBKR would be worth $64/share today – equal to the current stock price. In this scenario, Interactive Brokers’ NOPAT would grow just 3% compounded annually from 2025 to 2034. Contact us for the math behind this reverse DCF scenario.
Shares Could Go 42%+ Higher Even If Profits Grow Far Below Historical Rates
If we instead assume:
- NOPAT margin falls to 30% (equal to the company’s lowest ever margin in 2010) from 2025 through 2034,
- revenue grows at consensus rates in 2025 (11%), 2026 (7%), and 2027 (7%), and
- revenue grows 7% (continuation of 2027 consensus) each year thereafter through 2034, then
the stock would be worth at least $91/share today – a 42% upside to the current price. In this scenario, Interactive Brokers’ NOPAT grows just 5% compounded annually from 2025 through 2034. Contact us for the math behind this reverse DCF scenario.
Should Interactive Brokers grow profits grow more in line with historical rates, the stock has even more upside. Figure 10 compares the company’s historical NOPAT to the NOPAT implied in each of the above DCF scenarios.
Figure 10: Interactive Brokers’ Historical and Implied NOPAT: DCF Valuation Scenarios
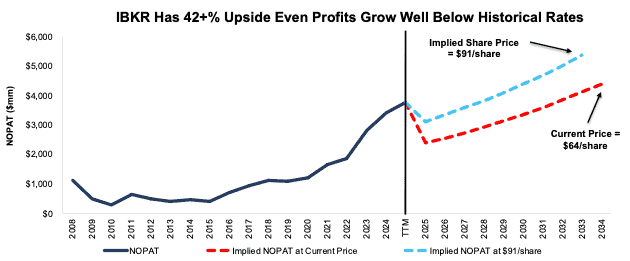
Sources: New Constructs, LLC and company filings
Sustainable Competitive Advantages Will Drive Shareholder Value Creation
Here’s a summary of why we think the moat around Interactive Brokers’ business will enable it to continue to generate higher NOPAT than the current market valuation implies:
- low-cost advantage driven by superior technology/automation,
- superior profitability compared to peers, and
- strong balance sheet.
What Noise Traders Miss with Interactive Brokers
These days, fewer investors focus on finding quality capital allocators with shareholder-aligned corporate governance. Due to the proliferation of noise traders, the focus is on short-term technical trading trends while more reliable fundamental research is overlooked. Here’s a quick summary of what noise traders are missing:
- recognized market leader in a growing industry,
- consistently growing Core Earnings, and
- valuation implies profit margins will deteriorate to levels never seen before.
Earnings Beats Could Send Shares Higher
Interactive Brokers has beaten earnings estimates in 4 of the past 10 quarters, so doing so more consistently could send shares higher.
Also, the company’s consistent top- and bottom-line growth help explain IBKR outperforming the overall Financial sector since the beginning of this year. Year-to-date, IBKR is up 36% while the Financial Select Sector SPDR Fund (XLF) is up just 12%. More consistent earnings beats could send shares even higher and further extend the stock’s outperformance.
Exec Comp Could Be Improved
Interactive Brokers’ executives receive performance awards based on three criteria: pre-tax income, adjusted pre-tax profit margin, and three-year adjusted net revenue growth.
We would prefer the company tie executive compensation to ROIC. Doing so ensures that executives’ interests are more aligned with shareholders’ interests as there is a strong correlation between improving ROIC and increasing shareholder value. Improving ROIC requires attention to all areas of the business, so including it in an executive compensation plan would incentivize executives to improve the entire business, not just one sales goal or earnings number.
Despite using adjusted pre-tax income and revenue growth goals in its executive pay, Interactive Brokers’ management has grown economic earnings, the true cash flows of the business, 30% compounded annually over the last decade, from $141 million in 2014 to $2.3 billion in the TTM ended 2Q25.
Insider Trading and Short Interest Trends
Over the past twelve months, insiders have purchased 1.7 million shares and sold 1.1 million shares for a net effect of 604,581 shares bought. These sales represent <1% of shares outstanding.
There are currently 10.0 million shares sold short, which equates to 2% of shares outstanding and two days to cover.
Attractive Funds That Hold IBKR
The following funds receive an Attractive-or-better rating and allocate significantly to IBKR:
- Neuberger Berman Quality Equity Fund (NBSTX, NRSRX, NRARX, NBSRX, NRAEX, NRACX, NBSLX) – 5.4% allocation and Attractive rating.
- Invesco S&P Mid Cap Momentum ETF (XMMO) – 5.0% allocation and Attractive rating.
- Gabelli Financial Services Opportunities ETF (GABF) – 4.7% allocation and Very Attractive rating.
- Formidable Fortress ETF (KONG) – 3.4% allocation and Very Attractive rating.
- Northern Lights Inspire Tactical Balanced ETF (RISN) – 3.3% allocation and Very Attractive rating.
This article was originally published on September 4, 2025.
Disclosure: David Trainer, Kyle Guske II, and Hakan Salt receive no compensation to write about any specific stock, sector, style, or theme.
Questions on this report or others? Join our online community and connect with us directly.