
This report analyzes[1] free cash flow (FCF), enterprise value, and the FCF yield for the NC 2000 and each of its sectors.
The NC 2000 consists of the largest 2000 U.S. companies by market cap in our coverage. Constituents are updated on a quarterly basis (March 31, June 30, September 30, and December 31). We exclude companies that report under IFRS and non-U.S. ADR companies.
For reference, we analyze the Core Earnings for the NC 2000 and each sector in All Cap Analysis: Net Income Understates Core Earnings in 2020. We analyze return on invested capital (ROIC) and its drivers in NC 2000 ROIC Title.
These reports leverage cutting-edge technology to provide clients with a cleaner and more comprehensive view of every measure of profits[2]. Investors armed with our research enjoy a differentiated and more informed view of the fundamentals and valuations of companies and sectors.
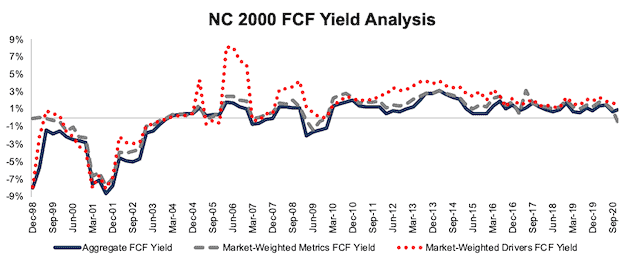
NC 2000 FCF Yield Slightly Rebounds From Lowest Level Since Mid-2019
FCF yield for the NC 2000 fell from 1.4% at the end of 2019 to 1.0% through 11/17/20 (the earliest date updated 10-Qs for the NC 2000 constituents were available). See Figure 1. Only three NC 2000 sectors have seen an increase in FCF yield since the end of 2019, as we’ll show below.
Figure 1: TTM FCF Yield for the NC 2000 From 1998 – 11/17/20
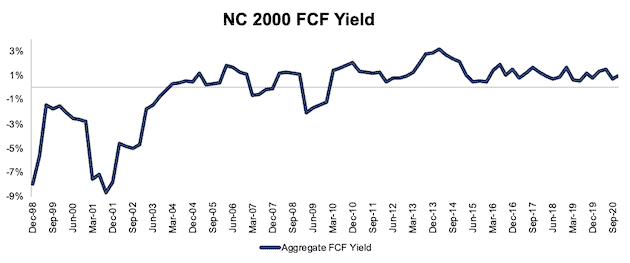
Sources: New Constructs, LLC and company filings.
Ranking the NC 2000 Sectors by FCF Yield
Figure 2 ranks all 11 NC 2000 sectors by change in FCF yield from the end of 2019 through 11/17/20.
Figure 2: NC 2000 TTM FCF Yield as of 11/17/20 by Sector
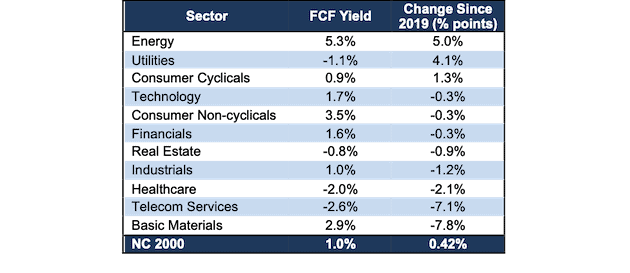
Sources: New Constructs, LLC and company filings.
Investors are getting more FCF for their investment dollar in the Energy sector than any other sector. On the flip side, the Telecom Services sector currently has the lowest FCF yield of all NC 2000 sectors.
The Energy, Utilities, and Consumer Cyclicals sectors are the only NC 2000 sectors that have each seen an increase in FCF yield since the end of 2019.
Details on Each of the NC 2000 Sectors
Figures 3-13 show the FCF yield trends for every NC 2000 sector since 1998.
We present the components of FCF yield, FCF and enterprise value, for the NC 2000 and each NC 2000 sector in Appendix I.
Appendix II provides additional aggregated FCF yield analyses that adjust for company size/market cap.
Basic Materials
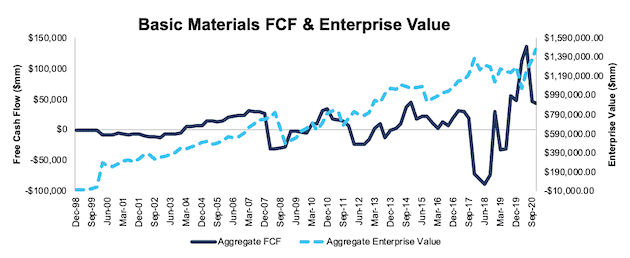
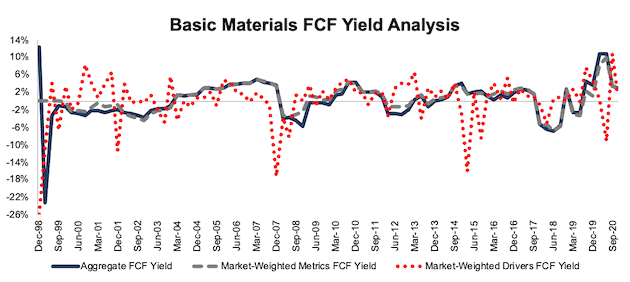
Figure 3 shows FCF yield for the NC 2000 Basic Materials sector increased significantly since mid-2018 even after the COVID-19-induced downturn in 2020. The FCF yield for the sector has fallen from 11% at the end of 2019 to 3% TTM. The Basic Materials sector FCF has fallen from $114 billion at the end of 2019 to $43 billion TTM while enterprise value increased from $1.1 trillion to $1.5 trillion over the same time.
Figure 3: Basic Materials FCF Yield: 1998 – 11/17/20
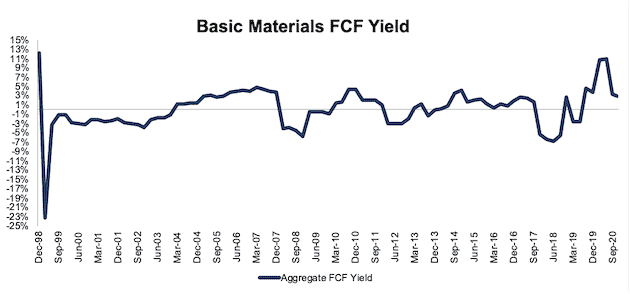
Sources: New Constructs, LLC and company filings.
Consumer Cyclicals
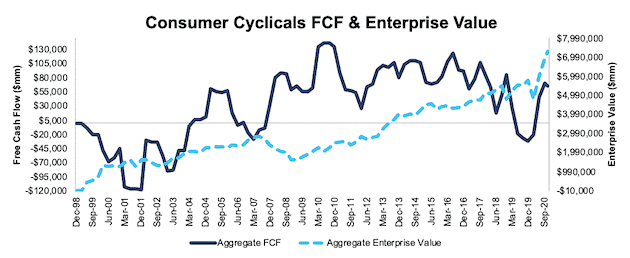
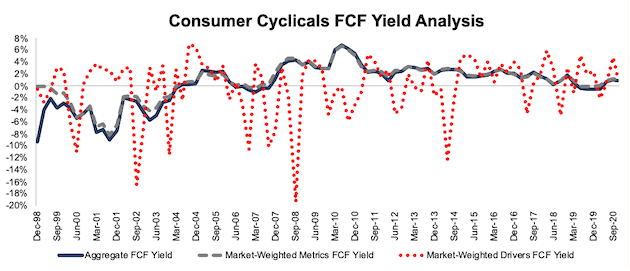
Figure 4 shows FCF yield for the Consumer Cyclicals sector has been in a long-term decline since 2010 despite increasing from -0.4% in 2019 to 0.9% TTM. The Consumer Cyclicals sector FCF has improved from -$21 billion at the end of 2019 to $65 billion TTM while enterprise value increased from $4.8 trillion to $7.3 trillion over the same time.
Figure 4: Consumer Cyclicals FCF Yield: 1998 – 11/17/20
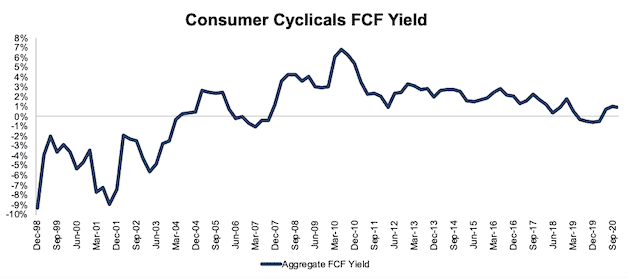
Sources: New Constructs, LLC and company filings.
Consumer Non-cyclicals
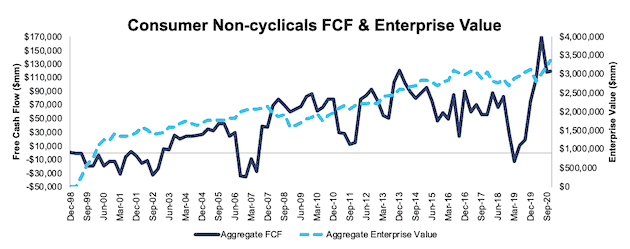
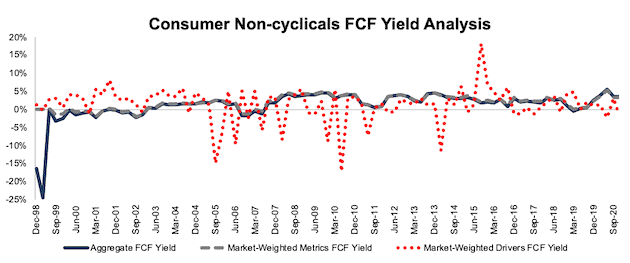
Figure 5 shows FCF yield for the Consumer Non-cyclicals sector rose in 2019 to 3.8% but has fallen to 3.5% TTM. The Consumer Non-cyclicals sector FCF has improved from $107 billion at the end of 2019 to $119 billion TTM while enterprise value has increased from $2.8 trillion to $3.4 trillion over the same time.
Figure 5: Consumer Non-cyclicals FCF Yield: 1998 – 11/17/20
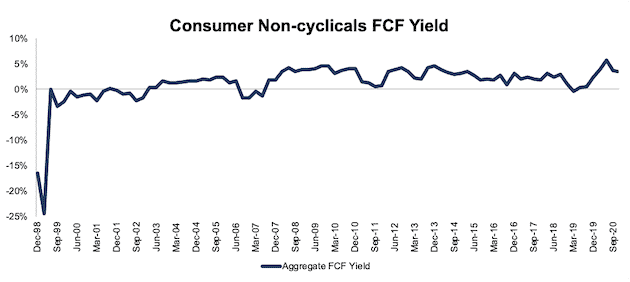
Sources: New Constructs, LLC and company filings.
Energy
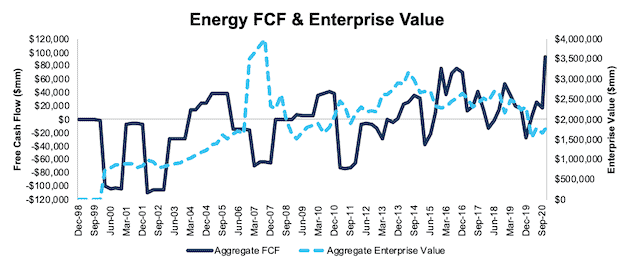
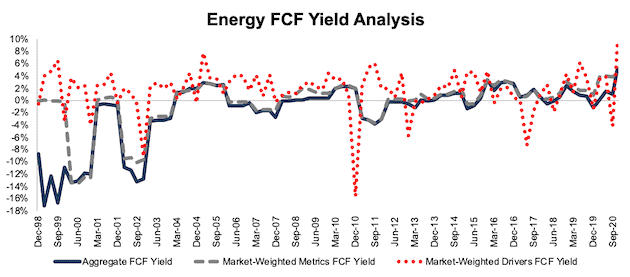
Figure 6 shows the volatile nature of FCF yield for the Energy sector in the early 2000s. More recently, the Energy sector’s FCF yield has increased from 0.2% at the end of 2019 to 5.3% TTM. The Energy sector FCF has increased from $3.6 billion in 2019 to $93 billion TTM while enterprise value increased from $1.5 trillion to $1.8 trillion over the same time.
Figure 6: Energy FCF Yield: 1998 – 11/17/20
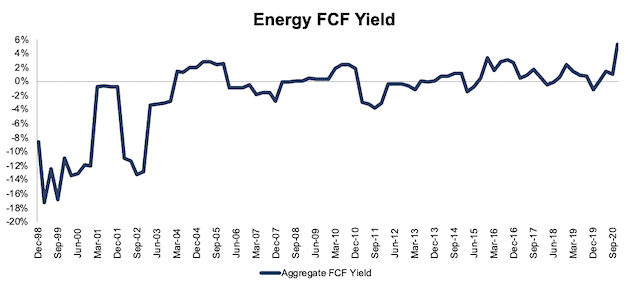
Sources: New Constructs, LLC and company filings.
Financials
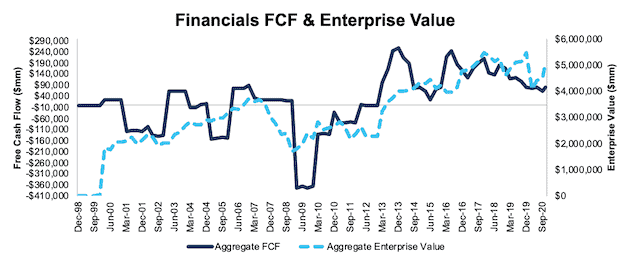
Figure 7 shows FCF yield for the Financials sector has been much more stable post the Financial Crisis in 2008/2009. The Financials sector FCF yield has fallen from 1.9% at the end of 2019 to 1.6% TTM. The sector’s FCF has increased from $77 billion in 2019 to $80 billion TTM while enterprise value increased from $4.1 trillion to $5.1 trillion over the same time.
Figure 7: Financials FCF Yield: 1998 – 11/17/20
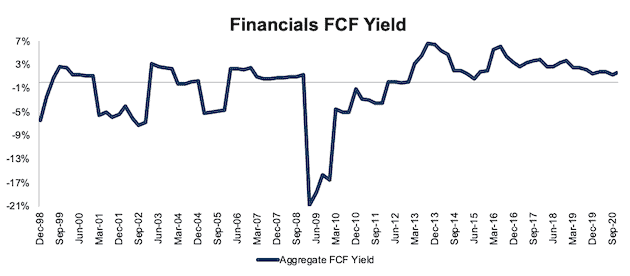
Sources: New Constructs, LLC and company filings.
Healthcare
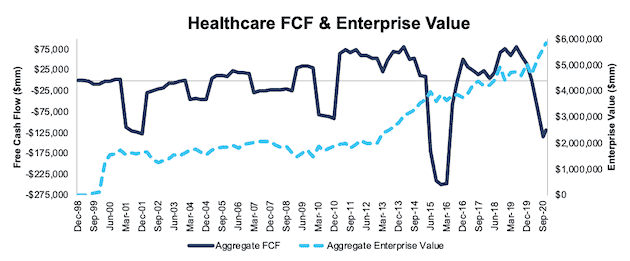
Figure 8 shows FCF yield for the Healthcare sector fell from 0% at the end of 2019 to -2.0% TTM. The decline in FCF yield stems from the fact that FCF has fallen from $1.6 billion in 2019 to -$119 billion TTM. Meanwhile, enterprise value increased from $4.6 trillion to $5.9 trillion over the same time.
Figure 8: Healthcare FCF Yield: 1998 – 11/17/20
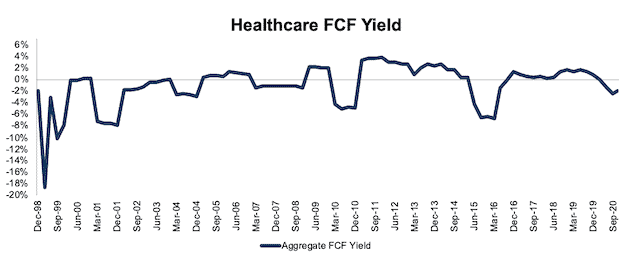
Sources: New Constructs, LLC and company filings.
Industrials
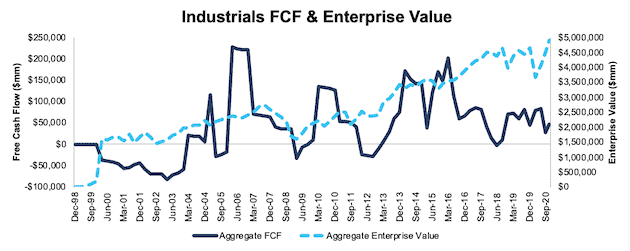
Figure 9 shows FCF yield for the Industrials sector has fallen from 2.2% in 2019 to 1.0% TTM. The Industrials sector FCF has fallen from $79 billion in 2019 to $48 billion TTM while enterprise value has increased from $3.7 trillion to $4.9 trillion over the same time.
Figure 9: Industrials FCF Yield: 1998 – 11/17/20
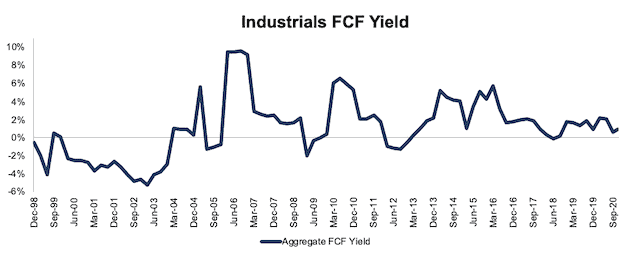
Sources: New Constructs, LLC and company filings.
Real Estate
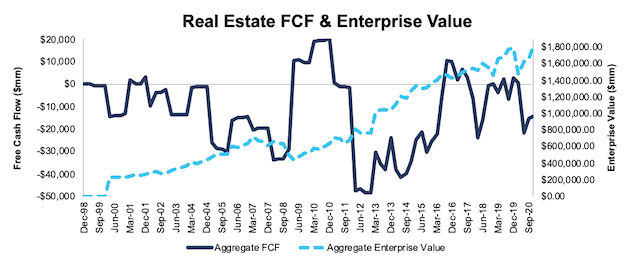
Figure 10 shows FCF yield for the Real Estate sector rather steadily improved from 2012-2019 before falling in 2020. The Real Estate sector FCF yield has fallen from 0% in 2019 to -0.8% TTM. FCF for the sector has declined from $728 million in 2019 to -$14 billion TTM while enterprise value has increased from $1.5 trillion to $1.8 trillion over the same time.
Figure 10: Real Estate FCF Yield: 1998– 11/17/20
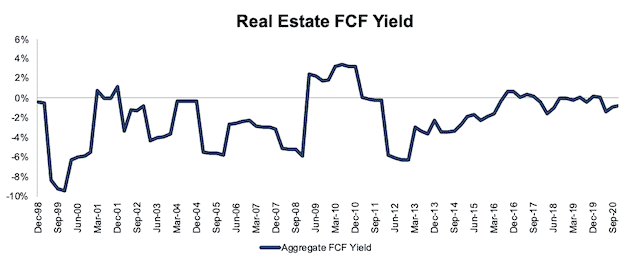
Sources: New Constructs, LLC and company filings.
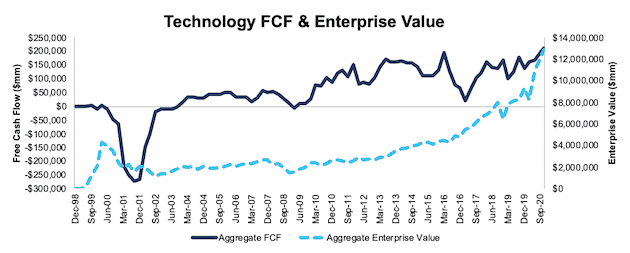
Technology
Figure 11 shows FCF yield for the Technology sector remains well below prior highs in 2011, 2013, and 2016, but well above the depths during the dot com bubble. The sector’s FCF yield fell has declined from 1.9% in 2019 to 1.7% TTM. The Technology sector FCF has increased from $160 billion in 2019 to $213 billion TTM while enterprise value has increased from $8.2 trillion to $12.8 trillion over the same time.
Figure 11: Technology FCF Yield: 1998 – 11/17/20
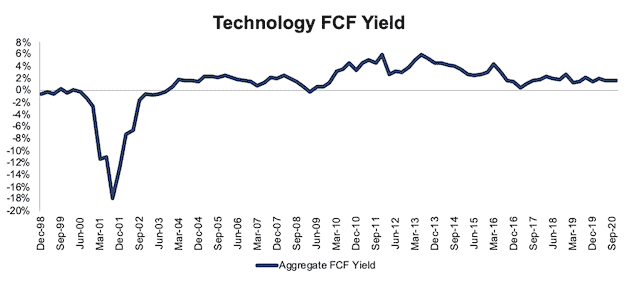
Sources: New Constructs, LLC and company filings.
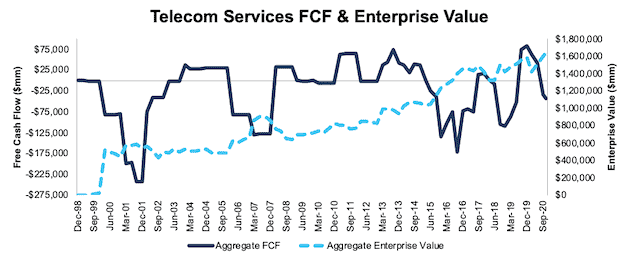
Telecom Services
Figure 12 shows FCF yield for the Telecom Services sector has fallen from 4.4% in 2019 to -2.6% TTM. The sector’s FCF has declined from $63 billion in 2019 to -$43 billion TTM while enterprise value has increased from $1.4 trillion to $1.6 trillion over the same time.
Figure 12: Telecom Services FCF Yield: December 1998 – 11/17/20
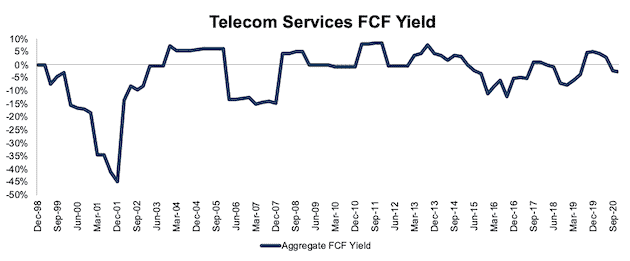
Sources: New Constructs, LLC and company filings.
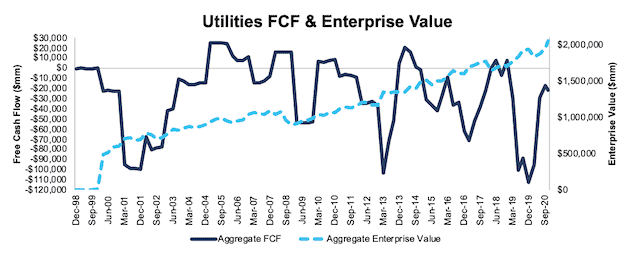
Utilities
Figure 13 shows the FCF yield for the Utilities sector is rather consistently negative and, despite improving since its 2019 lows, remains negative at -1.1%. The Utilities sector FCF has improved from -$95 billion in 2019 to -$22 billion TTM while enterprise value has increased from $1.8 trillion to $2.1 trillion over the same time.
Figure 13: Utilities FCF Yield: 1998 – 11/17/20
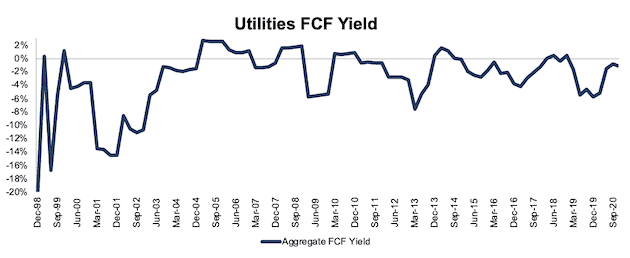
Sources: New Constructs, LLC and company filings.
This article originally published on December 14, 2020.
Disclosure: David Trainer, Kyle Guske II, and Matt Shuler receive no compensation to write about any specific stock, style, or theme.
Follow us on Twitter, Facebook, LinkedIn, and StockTwits for real-time alerts on all our research.
Appendix I: Free Cash Flow and Enterprise Value Since 1998
This appendix shows the two drivers used to calculate FCF yield – free cash flow and enterprise value – for the NC 2000 and each NC 2000 sector going back to December 1998. We sum the individual NC 2000/sector constituent values to arrive at the values we present for free cash flow and enterprise value. We call this approach the “Aggregate” methodology, and it matches S&P Global’s (SPGI) methodology for these calculations. More methodology details in Appendix II.
Figure 14 ranks all 11 sectors by TTM free cash flow.
Figure 14: Free Cash Flow by Sector – TTM as of 11/17/20
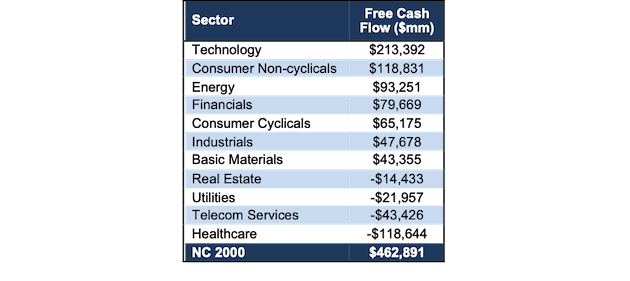
Sources: New Constructs, LLC and company filings.
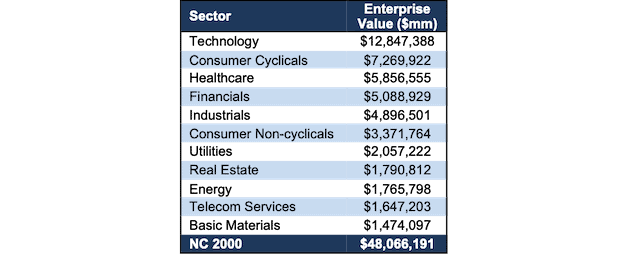
Figure 15 ranks all 11 sectors by TTM enterprise value.
Figure 15: Enterprise Value by Sector – TTM as of 11/17/20
Sources: New Constructs, LLC and company filings.
These two tables show the Technology sector not only generates the most free cash flow but it also has the highest enterprise value of all sectors.
Figures 16-27 compare the FCF and enterprise value trends for the NC 2000 and every sector since 1998.
Figure 16: NC 2000 FCF & Enterprise Value: 1998 – 11/17/20
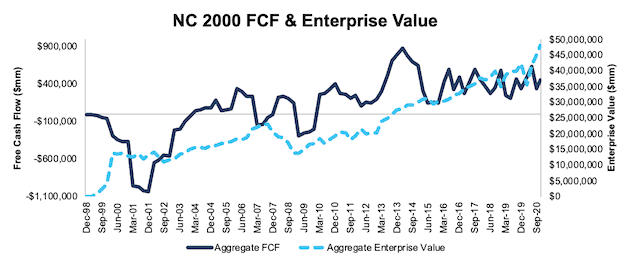
Sources: New Constructs, LLC and company filings.
Figure 17: Basic Materials FCF & Enterprise Value: 1998 – 11/17/20
Sources: New Constructs, LLC and company filings.
Figure 18: Consumer Cyclicals FCF & Enterprise Value: 1998 – 11/17/20
Sources: New Constructs, LLC and company filings.
Figure 19: Consumer Non-Cyclicals FCF & Enterprise Value: 1998 – 11/17/20
Sources: New Constructs, LLC and company filings.
Figure 20: Energy FCF & Enterprise Value: 1998 – 11/17/20
Sources: New Constructs, LLC and company filings.
Figure 21: Financials FCF & Enterprise Value: 1998 – 11/17/20
Sources: New Constructs, LLC and company filings.
Figure 22: Healthcare FCF & Enterprise Value: 1998 – 11/17/20
Sources: New Constructs, LLC and company filings.
Figure 23: Industrials FCF & Enterprise Value: 1998 – 11/17/20[3]
Sources: New Constructs, LLC and company filings.
Figure 24: Real Estate FCF & Enterprise Value: 1998 – 11/17/20
Sources: New Constructs, LLC and company filings.
Figure 25: Technology FCF & Enterprise Value: 1998 – 11/17/20
Sources: New Constructs, LLC and company filings.
Figure 26: Telecom Services FCF & Enterprise Value: 1998 – 11/17/20
Sources: New Constructs, LLC and company filings.
Figure 27: Utilities FCF & Enterprise Value: 1998 – 11/17/20
Sources: New Constructs, LLC and company filings.
Appendix II: Analyzing FCF Yield with Different Weighting Methodologies
We derive the metrics above by summing the individual NC 2000/sector constituent values for free cash flow and enterprise value to calculate FCF yield. We call this approach the “Aggregate” methodology.
The Aggregate methodology provides a straightforward look at the entire NC 2000/sector, regardless of market cap or index weighting, and matches how S&P Global (SPGI) calculates metrics for the S&P 500.
For additional perspective, we compare the Aggregate method for free cash flow with two other market-weighted methodologies. These market-weighted methodologies add more value for ratios that do not include market values, e.g. ROIC and its drivers, but we include them here, nonetheless, for comparison:
- Market-weighted metrics – calculated by market-cap-weighting the FCF yield for the individual companies relative to their sector or the overall NC 2000 in each period. Details:
- Company weight equals the company’s market cap divided by the market cap of the NC 2000/ its sector
- We multiply each company’s FCF yield by its weight
- NC 2000/Sector FCF yield equals the sum of the weighted FCF yields for all the companies in the NC 2000/sector
- Market-weighted drivers – calculated by market-cap-weighting the FCF and enterprise value for the individual companies in each sector/NC 2000 in each period. Details:
- Company weight equals the company’s market cap divided by the market cap of the NC 2000/ its sector
- We multiply each company’s free cash flow and enterprise value by its weight
- We sum the weighted FCF and weighted enterprise value for each company in the NC 2000/each sector to determine each sector’s weighted FCF and weighted enterprise value
- NC 2000/Sector FCF yield equals weighted NC 2000/sector FCF divided by weighted NC 2000/sector enterprise value
Each methodology has its pros and cons, as outlined below:
Aggregate method
Pros:
- A straightforward look at the entire NC 2000/sector, regardless of company size or weighting in any indices.
- Matches how S&P Global calculates metrics for the S&P 500.
Cons:
- Vulnerable to impact of companies entering/exiting the group of companies, which could unduly affect aggregate values. Also susceptible to outliers in any one period.
Market-weighted metrics method
Pros:
- Accounts for a firm’s market cap relative to the NC 2000/sector and weights its metrics accordingly.
Cons:
- Vulnerable to outlier results from a single company disproportionately impacting the overall FCF yield.
Market-weighted drivers method
Pros:
- Accounts for a firm’s market cap relative to the NC 2000/sector and weights its free cash flow and enterprise value accordingly.
- Mitigates the disproportionate impact of outlier results from one company on the overall results.
Cons:
- More volatile as it adds emphasis to large changes in FCF and enterprise value for heavily weighted companies.
Figures 28-39 compare these three methods for calculating NC 2000 and sector FCF yields.
Figure 28: NC 2000 FCF Yield Methodologies Compared: 1998 – 11/17/20
Sources: New Constructs, LLC and company filings.
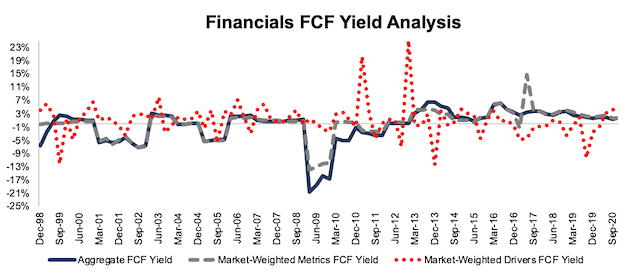
Figure 29: Basic Materials FCF Yield Methodologies Compared: 1998 – 11/17/20
Sources: New Constructs, LLC and company filings.
Figure 30: Consumer Cyclicals FCF Yield Methodologies Compared: 1998 – 11/17/20
Sources: New Constructs, LLC and company filings.
Figure 31: Consumer Non-cyclicals FCF Yield Methodologies Compared: 1998 – 11/17/20
Sources: New Constructs, LLC and company filings.
Figure 32: Energy FCF Yield Methodologies Compared: 1998 – 11/17/20
Sources: New Constructs, LLC and company filings.
Figure 33: Financials FCF Yield Methodologies Compared: 1998 – 11/17/20
Sources: New Constructs, LLC and company filings.
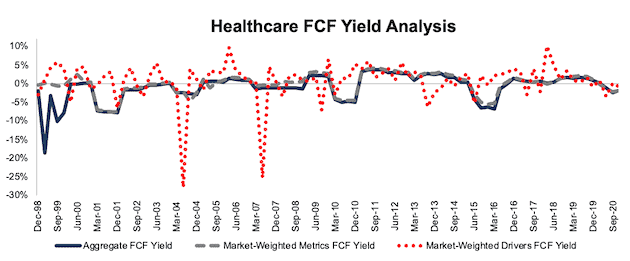
Figure 34: Healthcare FCF Yield Methodologies Compared: 1998 – 11/17/20
Sources: New Constructs, LLC and company filings.
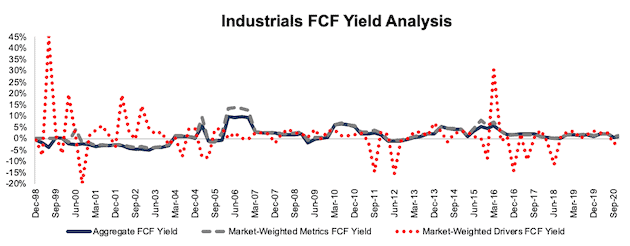
Figure 35: Industrials FCF Yield Methodologies Compared: 1998 – 11/17/20
Sources: New Constructs, LLC and company filings.
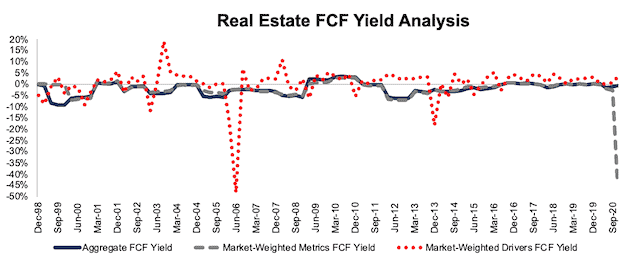
Figure 36: Real Estate FCF Yield Methodologies Compared: 1998 – 11/17/20
Sources: New Constructs, LLC and company filings.
Figure 37: Technology FCF Yield Methodologies Compared: 1998 – 11/17/20
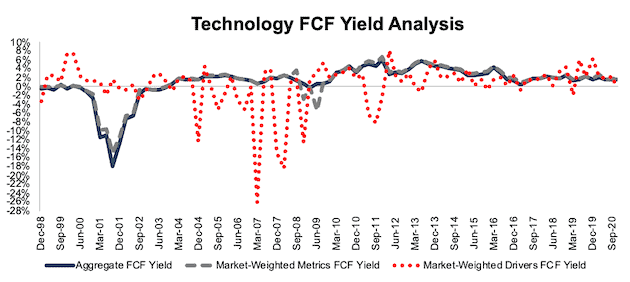
Sources: New Constructs, LLC and company filings.
Figure 38: Telecom Services FCF Yield Methodologies Compared: 1998 – 11/17/20
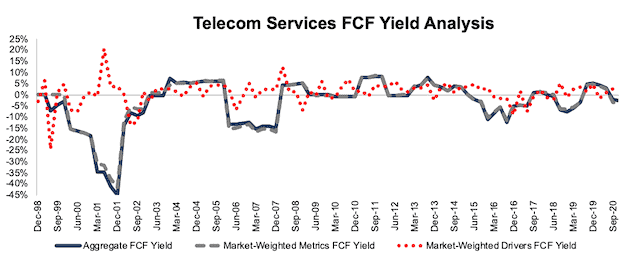
Sources: New Constructs, LLC and company filings.
Figure 39: Utilities FCF Yield Methodologies Compared: 1998 – 11/17/20
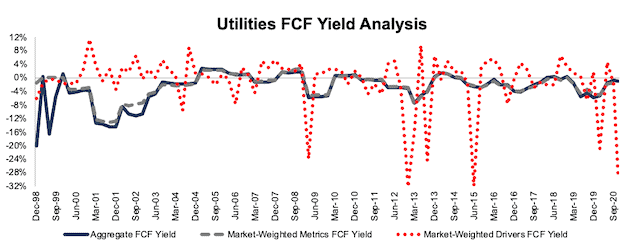
Sources: New Constructs, LLC and company filings.
[1] We calculate these metrics based on S&P Global’s (SPGI) methodology, which sums the individual NC 2000 constituent values for free cash flow and enterprise value before using them to calculate the metrics. We call this the “Aggregate” methodology. Get more details in Appendix II and III.
[2] For 3rd-party reviews, including The Journal of Financial Economics, on the benefits of adjusted Core Earnings, historically and prospectively, across all stocks, click here and here.
[3] The Industrials sector free cash flow is heavily influenced by General Electric (GE) in 2005. In 2005 GE restated ~$135 billion of Investment Securities to Assets of Discontinued Operations. This reclassification caused a large year-over-year increase in invested capital from 2004-2005, and therefore a large increase in FCF. However, due to poor disclosures in the filings, we’re unable to specifically track the changes beyond reclassifying an operating asset to a non-operating asset.