This report analyzes[1],[2] the trailing-twelve-months (TTM) price-to-economic book value (PEBV) ratio for the NC 2000[3], our All Cap Index, and each of its sectors based on financial filings from 1998 through the trailing-twelve-months (TTM) ended 2Q24.
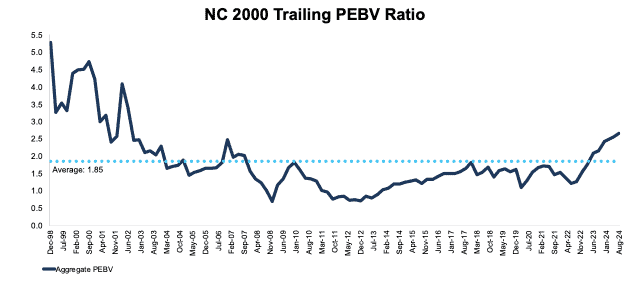
This trailing PEBV ratio compares the NC 2000’s expected future profits (as reflected in its price) to its economic book value as of 8/15/24. The NC 2000’s PEBV ratio of 2.7 implies the profits (NOPAT) of the NC 2000 will permanently increase 170% from TTM ended 2Q24 levels.
Last quarter’s of analysis of the PEBV for the NC 2000 and each sector is here. You can find our macro analysis on other key metrics here.
NC 2000 Trailing PEBV Ratio Rose Slightly from 5/16/24 to 8/15/24
The trailing PEBV ratio for the NC 2000 rose from 2.6 as of 5/16/24 to 2.7 as of 8/15/24, per Figure 1. The NC 2000 market cap increased by $2.1 trillion while economic book value decreased by $112.6 billion over the same time. More details in Appendix I.
Figure 1: Trailing PEBV Ratio for the NC 2000 From December 1998 – 8/15/24
Sources: New Constructs, LLC and company filings.
The August 15, 2024 measurement period uses price data as of that date and incorporates the financial data from 2Q24 10-Qs, as this is the earliest date for which all of the 2Q24 10-Qs for the NC 2000 constituents were available.
Ranking All Sectors by Trailing Price to Economic Book Value Ratio
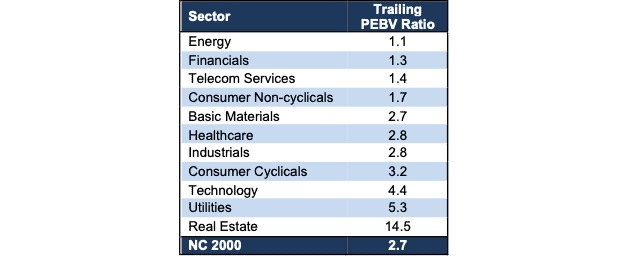
None of the NC 2000 sectors trade at-or-below their economic book value. Figure 2 shows that the Energy sector has the lowest trailing PEBV ratio among the eleven All Cap Index sectors based on prices as of 8/15/24 and financial data from 2Q24 10-Qs.
Figure 2: Trailing PEBV Ratios for all NC 2000 Sectors as of 8/15/24
Sources: New Constructs, LLC and company filings.
Price as of 8/15/24, financial data incorporates 2Q24 10-Qs.
A trailing PEBV ratio of 1.1 means the market expects the Energy sector’s profits to grow only 10% from TTM ended 2Q24 levels. On the flip side, investors expect the Utilities and Real Estate sectors (trailing PEBV ratios of 5.3 and 14.5) to improve profits more than any other NC 2000 sectors.
Details on Each of the NC 2000 Sectors
Figures 3 through 13 show the trailing PEBV ratio trends for every sector since December 1998. Note that the current PEBV ratios are based on prices as of August 15, 2024 and the latest financial data available, mostly 2Q24 10-Qs.
To view the full report and all exhibits, download the PDF here.
This article was originally published on September 6, 2024.
Disclosure: David Trainer, Kyle Guske II, and Hakan Salt receive no compensation to write about any specific stock, style, or theme.
Questions on this report or others? Join our online community and connect with us directly.
[1] We calculate these metrics based on S&P Global’s (SPGI) methodology, which sums up individual NC 2000 constituent values for market cap and economic book value before using them to calculate the metrics. We call this the “Aggregate” methodology. Get more details in Appendices I and II.
[2] Based on latest available audited financial data, which is the 2Q24 10-Q in most cases. Price data is as of 8/15/24. Price data is as of 8/15/24. QoQ analysis is based on the change since last quarter.
[3] The NC 2000 consists of the largest 2000 U.S. companies by market cap in our coverage. Constituents are updated on an end-of-quarter basis. We exclude companies that report under IFRS and non-U.S. ADR companies.
[/opmIf]

