
This week’s Filing Season Finds report highlights Nokia Corporation (NOK: $5/share) for understating its profits by $164 million (12% of GAAP earnings). It is just one of the discoveries from the many 10-Ks and 10-Qs our Robo-Analyst[1] analyzed in the fifth week of Filing Season.
Understated Profits + Cheap Valuation = Very Attractive Rating
In Nokia’s 2024 20-F, analyst Lee Moneta-Koehler leveraged our Robo-Analyst to find $164 million in net hidden and reported Earnings Distortion that included:
Hidden
- -$632 million in impairment charges – Page 133
- -$160 million in restructuring charges included in cost of sales – Page 142
- -$143 million in restructuring charges included in SG&A – Page 142
- -$139 in restructuring charges included in research & development – Page 142
- Total: -$1.1 billion
Reported
- -$743 million contra adjustment for recurring pension costs. These recurring expenses are reported in non-recurring line items, so we add them back and exclude them from Earnings Distortion
- -$442 million after-tax loss from discontinued operations
- -$73 million in other financial losses – Page 143
- -$13 million in net fair value losses on hedged items – Page 143
- -$6 million in other financial expenses – Page 143
- -$1 million in negative interest on financial investments – Page 143
- $10 million in net fair value gains on hedging instruments – Page 143
- $17 million in foreign exchange gains – Page 143
- $24 million in foreign exchange gains on hedging forecasted sale and purchases – Page 143
- $49 million gain from venture funds – Page 143
- $55 million in income tax distortion
- $72 million gain on sale of businesses – Page 143
- $98 million gain on sale of property, plant, and equipment – Page 143
- $182 million interest income on defined benefit plans – Page 143
- $199 million gain on sale of associated companies – Page 143
- Total: $913 million
These unusual losses are found only with careful analysis of all statements and, most importantly, the footnotes and management’s discussion and analysis, which legacy firms tend to ignore.
NOK’s outperformance year-to-date looks more than justified considering it is even more profitable than GAAP earnings would show.
After removing these non-operating items (net -$164 million, or 12% of GAAP earnings), we find that Nokia’s 2024 Core Earnings of $1.5 billion, or $0.27/share, are much higher than GAAP earnings of $1.3 billion, or $0.24/share.
With Core Earnings higher than GAAP earnings, a 16% return on invested capital (ROIC), and a valuation that implies the company’s profits will permanently decline, Nokia earns a Very Attractive Stock Rating. NOK was upgraded from an Attractive rating after we parsed its 2024 20-F.
Profits are an indication of a good business, but a good business is only worth buying at a good price. At its current price, NOK’s price-to-economic book value (PEBV) ratio is 0.9. This ratio means the market expects Nokia’s profits to permanently fall 10% from 2024 levels. Furthermore, in the default scenario of our reverse discounted cash flow (DCF) model, NOK has a market-implied Growth Appreciation Period (GAP) of just 1 year.
For reference, Nokia has grown net operating profit after tax (NOPAT) by 7% compounded annually over the past decade.
High Risk Stocks Due to Weak Internal Controls
Remember how much Super Micro Computer, Inc. (SMCI) stock dropped when its auditor announced that it would no longer represent Super Micro Computer last October? Long before the stock sank over 50%, we warned, in late August, of the company’s Weak Internal Controls.
Over the past month, our Robo-Analyst found 32 companies with Unattractive-or-worse ratings that disclosed material weaknesses in internal controls in their financial filings. Weaknesses in internal controls increase the risk that the company’s financials are fraudulent and/or misleading. Identifying this risk is necessary due diligence for every investment process as shown with the Super Micro Computer situation.
This list does not include only small unknown companies. Axon Enterprise (AXON), for instance, has a market cap nearing $44 billion.
Figure 1 lists 3 of the largest companies with material weakness in internal controls and an Unattractive-or-worse Stock Rating from 2025 Filing Season. Contact us for the complete list.
Figure 1: Weak Internal Controls & Unattractive-or-Worse Ratings – Identified During Filing Season

Sources: New Constructs, LLC and company filings.
The Power of the Robo-Analyst
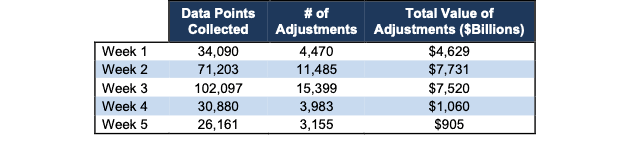
From the many 10-K and 10-Q filings analyzed by our Robo-Analyst in the fifth week of Filing Season (March 9 through March 15), we collected 26,161 data points. This data led to 3,155 Core Earnings, balance sheet, and valuation adjustments with a combined dollar value of $905 billion. The adjustments were applied as follows:
- 1,336 income statement adjustments with a total value of $59.2 billion
- 1,204 balance sheet adjustments with a total value of $378.2 billion
- 615 valuation adjustments with a total value of $467.4 billion
Figure 2: Filing Season Diligence for 2024 10-K Filing Season: Feb-Mar 2025
Sources: New Constructs, LLC and company filings.
Every year from mid-February through early March, we parse and analyze over 2,000 10-Ks and 10-Qs to update our models for companies with 12/31 and 1/31 fiscal year ends. This combination of technology and human expertise enables investors to overcome the flaws in legacy fundamental research and make more informed investment decisions.
Proprietary Footnotes Data Drives Alpha
While we’re explaining the diligence required to calculate Core Earnings and generate proven-superior Stock Ratings, we want to show you how both deliver alpha. We’ve developed multiple indices for tracking the performance of portfolio strategies based on Core Earnings and our Stock Ratings. All are outperforming the S&P 500 this year. See Figures 3 and 4.
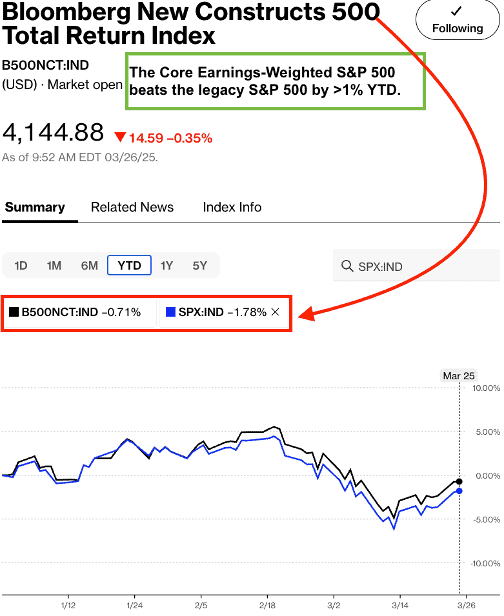
Figure 3 compares the performance of the Bloomberg New Constructs 500 Index (ticker: B500NCT:IND), managed by Bloomberg, to the S&P 500. This index takes the top 500 stocks by market cap and tilts toward the companies with high Earnings Capture, based on our proprietary Core Earnings data. From January 1 to March 25, 2025, the Bloomberg New Constructs 500 Total Return Index (ticker: B500NCT:IND) is down 0.71% while the S&P 500 is down 1.78%.
Figure 3: Bloomberg New Constructs 500 Index Strongly Outperforms the S&P 500 Year to Date
Sources: Bloomberg
Note: Past performance is no guarantee of future results.
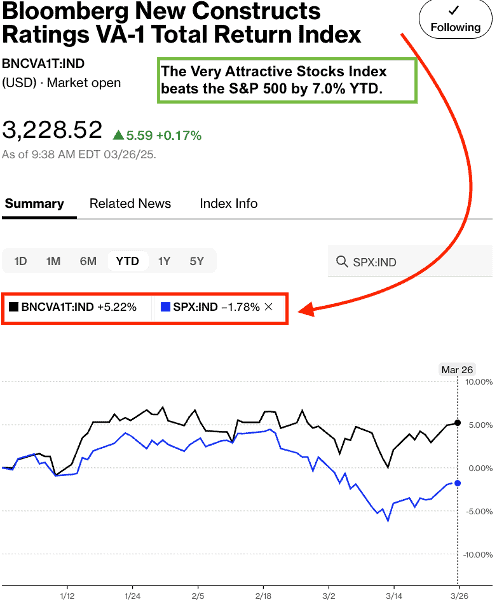
Figure 4 compares the performance of the Bloomberg New Constructs Ratings VA-1 Index (ticker: BNCVA1T:IND), managed by Bloomberg, to the S&P 500. This index tracks the stocks in the Bloomberg 1000 Index that earn our Very Attractive Rating. From January 1 to March 25, 2025, the Bloomberg New Constructs Ratings VA-1Index (ticker: BNCVA1T:IND) is up 5.2% while the S&P 500 is down 1.8%.
Figure 4: Very Attractive-Rated Stocks Strongly Outperform the S&P 500 Year to Date
Sources: Bloomberg
Note: Past performance is no guarantee of future results.
This article was originally published on March 26, 2025.
Disclosure: David Trainer, Lee Moneta-Koehler, Kyle Guske II, and Hakan Salt receive no compensation to write about any specific stock, sector, style, or theme.
Questions on this report or others? Join our online community and connect with us directly.
[1] Harvard Business School features the powerful impact of our research automation technology in New Constructs: Disrupting Fundamental Analysis with Robo-Analysts.